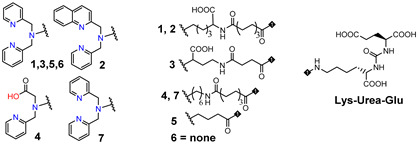
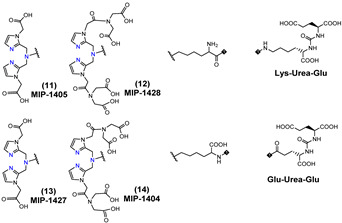
Table 3.
PSMA-i labeled with [99mTc][Tc(CO)3]+-fragment.
| Chelator Linker Scaffold | Affinity | Performance | Ref. | |
|---|---|---|---|---|
|
[Tc(CO)3]1–7
(2008) |

|
a 10.75 (1) 0.50 (2) 10.34 (3) 0.17 (4) 0.91 (5) 199.56 (6) 2.06 (7) |
Complexes were evaluated on PC3-PIP/PC3-flu xenografts. PSMA-dependent tumor uptake picked at 0.5–1 h p.i, followed by rapid washout. Rapid clearance from the kidneys. High spleen uptake followed by elimination. Clinical translation: No |
[105] |
|
[Tc(CO)3]8–10
(2013) |

|
b 15.25 1.12 (8) 12.60 (9) 16.30 (10) |
Complexes were evaluated on PC3-PIP/PC3-flu xenografts. [Tc(CO)3]8 is the best of the series. High and stable PSMA-dependent tumor uptake picked at 0.5 h p.i, uptake (28.31 ± 4.4% ID/g at 0.5 h vs. 23.22 ± 6.02% ID/g at 5 h p.i). High kidney uptake followed by slow washout. High spleen uptake followed by elimination. Clinical translation: No |
[106] |
|
[Tc(CO)3]11–14
(2013) |

|
c 4.35 ± 0.35 (11) 1.75 ± 0.32 (12) 0.64 ± 0.46 (13) 1.07 ± 0.89 (14) |
Complexes were investigated on LNCaP/PC3 xenografts. High and stable tumor uptake ranged from 9.3 to 12.4% ID/g at 1 h p.i and 7.2–11.0% ID/g at 4 h. High tumor-to-blood ratios ranging from 29:1 to 550:1 and tumor–to–muscle ratios ranging from 31:1 to 157:1 at 4 h. Liver and intestinal uptake were <1% ID/g for all compounds. Rapid clearance from the kidneys. Low spleen uptake. Clinical translation: Yes |
[34,107,108] |
a PSMA inhibitory affinity was determined using the corresponding rhenium complexes. Data are reported as *Ki (nM); b PSMA inhibitory affinity was determined by using the ligands, and data are reported as Ki (nM). c Binding specificity of 99mTc-labeled PSMA-i was determined by saturation binding analysis in the presence of the corresponding rhenium compound or 2-PMPA. Data are reported as Kd (nM).
