Figure 3.
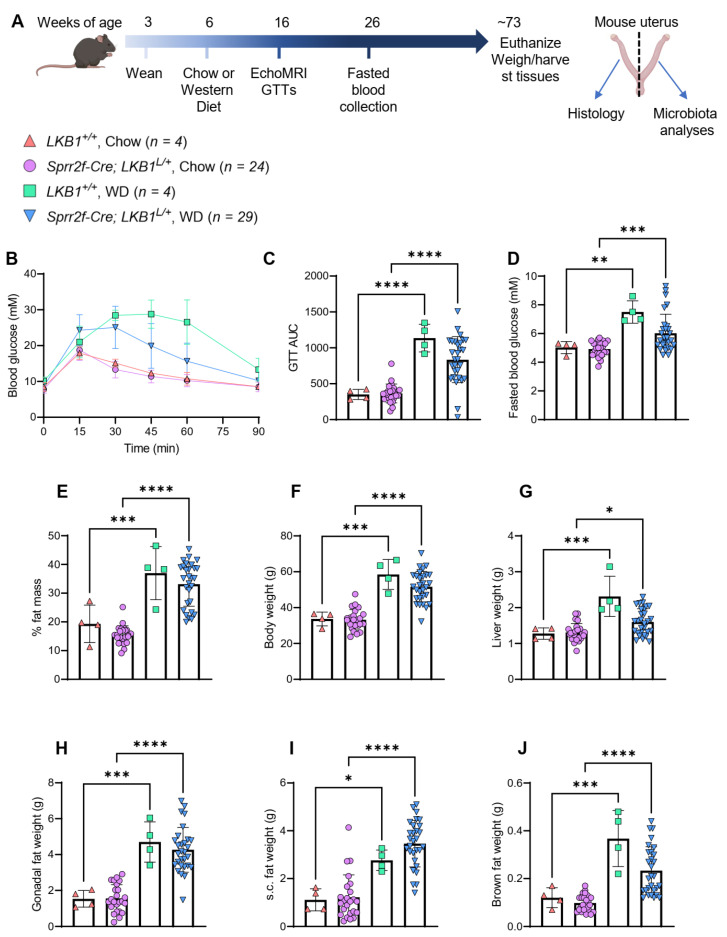
Long-term Western diet-induced model of obesity in female mice. (A): Schematic overview of mouse study, where female mice lacking one copy of liver kinase B1 (LKB1) in the endometrium (Sprr2f-Cre: LKB1L/+) or wild-type littermates (LKB1+/+) were weaned at 3 weeks of age, fed chow diet until 6 weeks of age, and then continued either on chow or Western diet (WD) at 6 weeks of age. Fat mass was measured by EchoMRI and glucose tolerance tests (GTTs) were performed at 16 weeks of age. Blood samples were collected following a 17-h fast at 26 weeks of age. Mice were euthanized at ~73 weeks of age (~510 days old). Mice uteri were cut in half for histological and microbiota analysis. (B): Glucose tolerance test (GTT), whereby mice were injected with 2 g/kg glucose (intraperitoneal, i.p.) and their blood glucose levels (millimolar, mM) were measured over time. (C): Area under the curve values from the GTT for each of the 4 groups. (D): Blood glucose levels (mM) were measured in mice following a 17 h fast. (E): Percentage (%) fat mass of mice was measured using echo magnetic resonance imaging (MRI). (F): Final mouse body weights at study completion. (G): Liver weights of mice at study completion. (H): Gonadal fat weights (both pads) of mice at study completion. (I): Subcutaneous fat weights (both pads) of mice at study completion. (J): Brown fat weights of mice at study completion. Mouse numbers for each group are displayed next to the symbols, with n = 4 for LKB1+/+ on chow and Western diets, n = 24 for Sprr2f-Cre: LKB1L/+ mice on chow diet, and n = 29 for Sprr2f-Cre: LKB1L/+ mice on Western diet (WD). Mouse data was analyzed by 2-way ANOVA with Tukey’s test for multiple comparisons (alpha = 0.05). Data bars indicate the mean and error bars indicate standard deviation. * p < 0.05, ** p < 0.01, *** p < 0.001, **** p < 0.0001.

