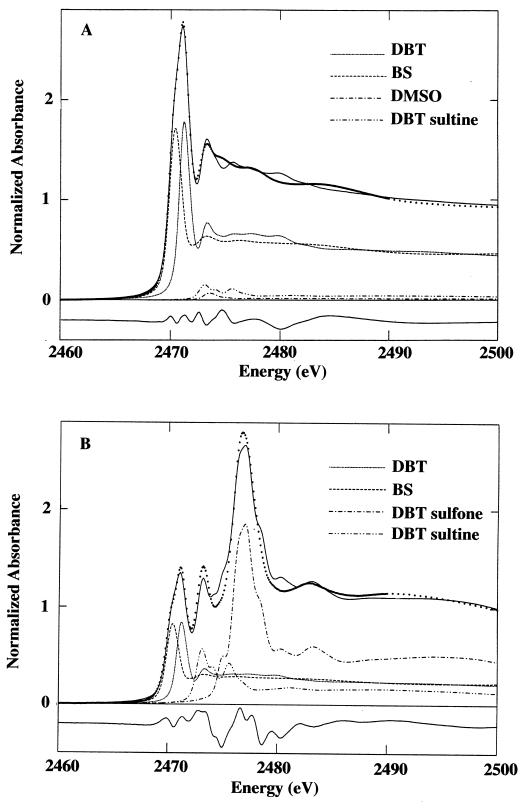
FIG. 6.
Linear fits (solid lines) of the sulfur K-edge X-ray absorption spectra of a combination of model compounds to the spectra of OB oil diluted in decane (dotted lines) from sterile control (A) and Rhodococcus sp. strain ECRD-1-desulfurized (B) cultures. The spectra of the individual model compounds contributing to the fit are shown below the oil spectra and fits. The difference between the fit and the experimental data is shown beneath each panel.

