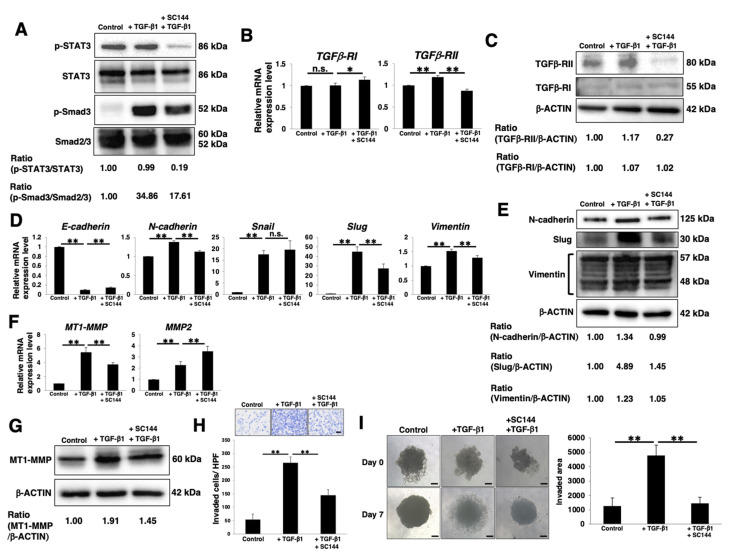
Figure 5.
Correlation between gp130/STAT3 and the TGF/Smad pathway. PANC-1 cells were cultured for 4 days in 3D (sphere) conditions with or without 1 μM SC144 and further incubated for 3 days with or without 10 ng/mL TGF-β1. The cells were harvested and then used in following experiments. (A) Western blot analysis of p-gp130, gp130, p-STAT3, and STAT3. Relative band intensity is presented. (B) Real-time qPCR analysis of TGFβ-RI and TGFβ-RII. Results are normalized to values obtained for control cells (value = 1). Results are presented as means ± SD from three independent experiments. (C) Western blot analysis of TGFβ-RI, TGFβ-RII and β-ACTIN. Relative band intensity is presented. (D) Real-time qPCR analysis of EMT markers. Results are normalized to values obtained for control cells (value = 1). Results are presented as means ± SD from three independent experiments. (E) Western blot analysis of EMT markers and β-ACTIN (control). The relative band intensity is presented. (F) Real-time qPCR analysis of MT1-MMP and MMP2. Results are normalized to values obtained for control cells (value = 1). Results are presented as means ± SD from three independent experiments. (G) Western blot analysis of MT1-MMP and β-ACTIN. Relative band intensity is presented. (H) Matrigel invasion assays in PANC-1 sphere cells. Representative results from measurements of 12 fields are presented. Scale bar: 100 μm. (I) 3D invasion assay. Scale bar: 5 μm. The histograms indicate the invaded area. Results are presented the as means ± SD from four sphere images. * p < 0.05; ** p < 0.01, n.s.: not significant.

