Figure 5.
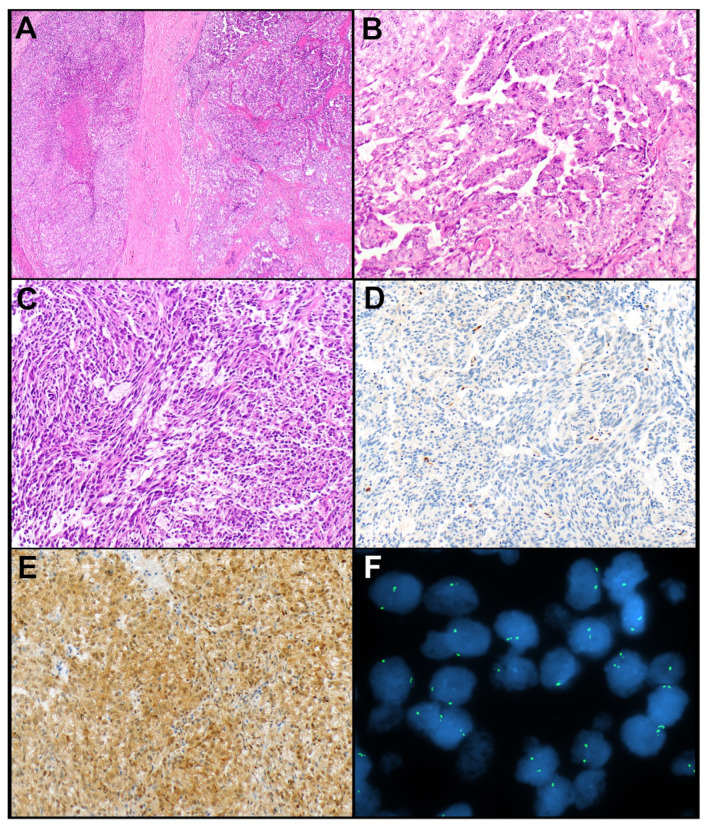
Thymic adenocarcinoma (same case as Figure 1A–C). (A) This adenocarcinoma was comprised of solid (left-hand side and Figure 1A,B) and papillary (right-hand side) patterns. (B) Neoplastic cells are lining thin fibrovascular cores consistent with a papillary growth pattern. (C) In some areas, the tumor was comprised of a spindle cell/sarcomatoid component. (D) mTAP expression was lost in the tumor cells of the sarcomatoid component (and the solid component that is shown in Figure 1A,B, respectively, not shown), while mTAP expression was preserved in other areas of the tumor (E). (F) Homozygous deletion of CDKN2A (fluorescence in situ hybridization [FISH], two green signals and no red signal) was observed prepared from the same tumor area that showed loss of expression of mTAP (D). FISH studies were not performed in tumor areas that revealed expression of mTAP in tumor cells. Magnification, H&E × 40 (A), × 200 (B,C), mTAP × 200 (D,E), CDKN2A FISH × 1000 (oil) (F).

