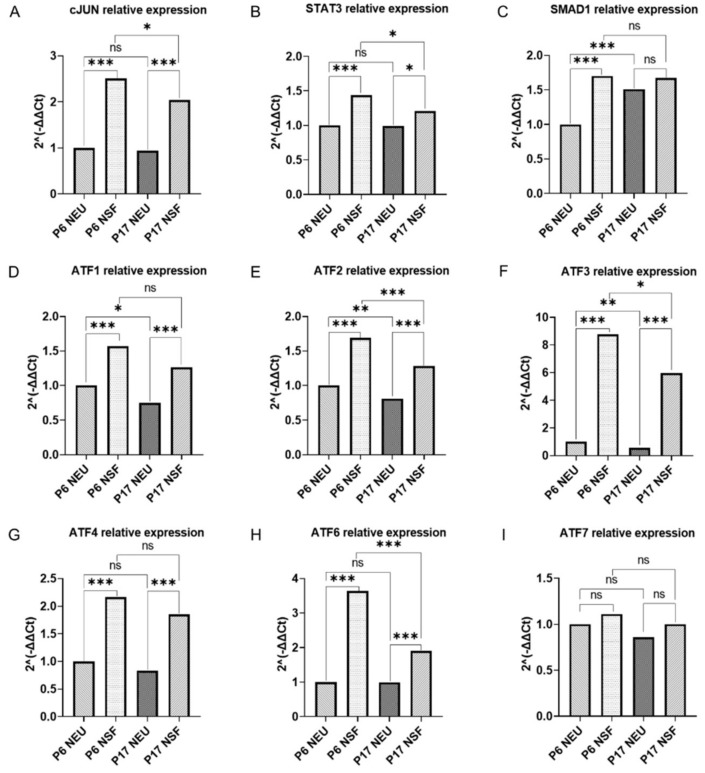
Figure 1.
Difference in RAG and ATF gene expression in neurons versus neurospheres. Difference in gene expression between P6 and P17 neurons (NEU) and neurospheres (NSF) was measured by RT-qPCR, normalized to GAPDH mRNA levels, and shown as fold difference compared to P5–6 neurons mRNA levels. mRNA was obtained from cortical neurons, and neurospheres at DIV7 derived from opossums P5-6 and P16-17 from at least three independent experiments. Regeneration-associated genes (A–C), activating transcription factors (D–I). The accepted level of significance was p < 0.05. p < 0.001 very significant ***, 0.001–0.01 very significant **, 0.01–0.05 significant *, ≥0.05 not significant (ns). For statistical significance and tests performed, see Supplementary Figure S1.

