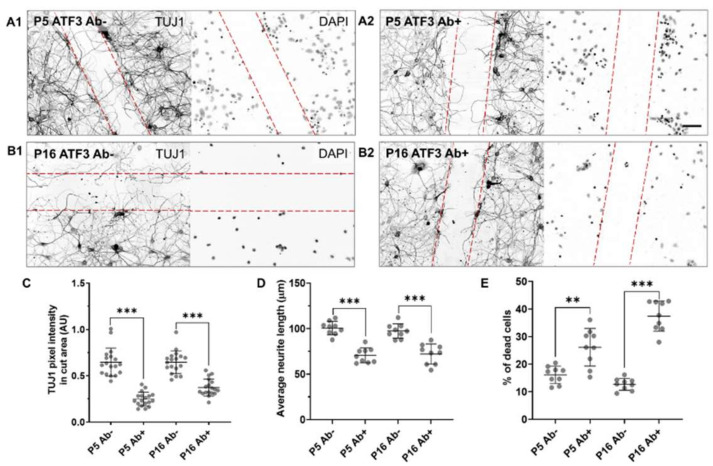
Figure 8.
Inhibition of neuroregeneration by ATF3 antibody. (A1,B1) represents a control neuronal culture treated with PBS only. ATF3 antibody was added to P5 (A2) and P16 (B2) opossum cortical neurons in cell culture medium at DIV9 immediately after scratch. Neurons were fixed 24 h later and immunostained for TUJ1 (left panels). Nuclei were counterstained for DAPI (right panels). The scratch area is defined by the red dashed lines. Scale bar is 50 μm. (C) Scatter plot represents P5 and P16 average TUJ1 pixel intensities. Data are shown as mean ± SD. For each condition, 2 ROIs of 3 random fields per sample from 3 culture preparations were analyzed. Welch’s t-test, P5 Ab- vs. P5 Ab+ p < 0.001 ***. Unpaired t-test, P16 Ab- vs. P16 Ab+ p < 0.001 ***. (D) Scatter plot represents P5 and P16 average neurite length of TUJ1-positive neurons. Data are shown as mean ± SD. Number of neurites analyzed: P5 Ab- 270; P5 Ab+ 230; P16 Ab- 245; P16 Ab+ 214. Unpaired t-test P5 Ab- vs. P5 Ab+ p < 0.001 ***. Unpaired t-test, P16 Ab- vs. P16 Ab+ p < 0.001 ***. (E) Scatter plot represents the percentage of dead cells for P5 and P16 cortical cultures. Data are shown as mean ± SD. Number of cells analyzed: P5 Ab- 608; P5 Ab+ 784; P16 Ab- 516; P16 Ab+ 433. Welch’s t test P5 Ab- vs. P5 Ab+ p = 0.002 **. Welch’s t test, P16 Ab- vs. P16 Ab+ p < 0.001 ***. Images of 3 random fields were analyzed per sample from 3 culture preparations. The accepted level of significance was p < 0.05. p < 0.001 very significant ***, 0.001–0.01 very significant **, 0.01–0.05 significant *, ≥0.05 not significant (ns).

