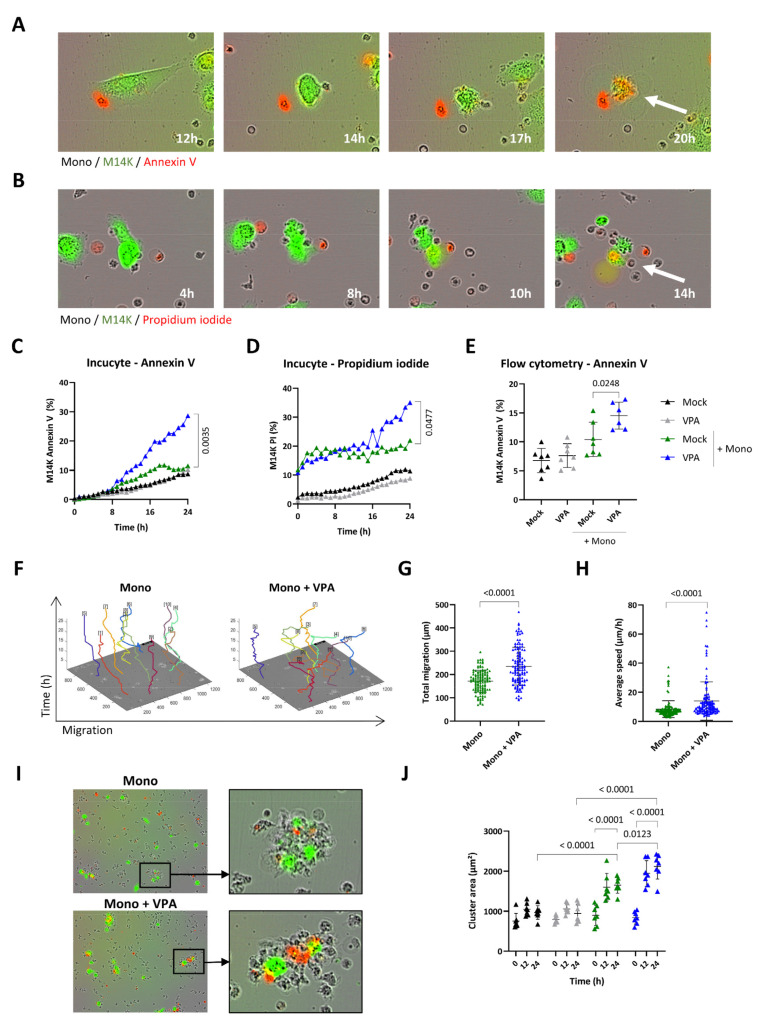
Figure 3.
Effect of VPA on primary monocyte migration and cytotoxicity. (A,B) Blood-derived monocytes (Mock) were cocultured with CFSE-labeled M14K cells at a 20/1 ratio. Representative Incucyte kinetics upon labeling with annexin V-APC (A) or propidium iodide (B). (C,D) Single-cell imaging data from nine independent experiments were recorded by Incucyte. The graphs represent the mean percentages of CFSE-labeled M14K cells staining for annexin V (C) or propidium iodide (D). Statistical significance was evaluated using a one-way ANOVA with Tukey’s multiple comparison test. (E) After 24 h of coculture, cells were stained with annexin V-APC and analyzed by flow cytometry. Mean (±standard deviation) percentages of CFSE-positive M14K cells labeled with annexin V were deduced from seven independent experiments. Statistical significance was evaluated using one-way ANOVA with Tukey’s multiple comparison test. (F) Based on Incucyte images, cell motility of 10 monocytes per condition performed in triplicate was determined with the CellTracker software. Total migration (G) and average speed (H) data are the means (±standard deviations) of four independent experiments. The statistical significance was evaluated with non-parametric Kruskal–Wallis followed by a Dunn’s multiple comparison test. (I) Representative Incucyte images of clusters formed by monocytes and CFSE-labeled M14K cells in the presence of mock or VPA. (J) Using ImageJ, the mean area of 10 clusters formed by M14K cells alone or in interaction with one or several monocytes was measured in triplicate at 0, 12, and 24 h. Data are the means (±standard deviations) of seven independent experiments. The statistical significance was evaluated with a two-way ANOVA followed by a Tukey’s multiple comparison test.

