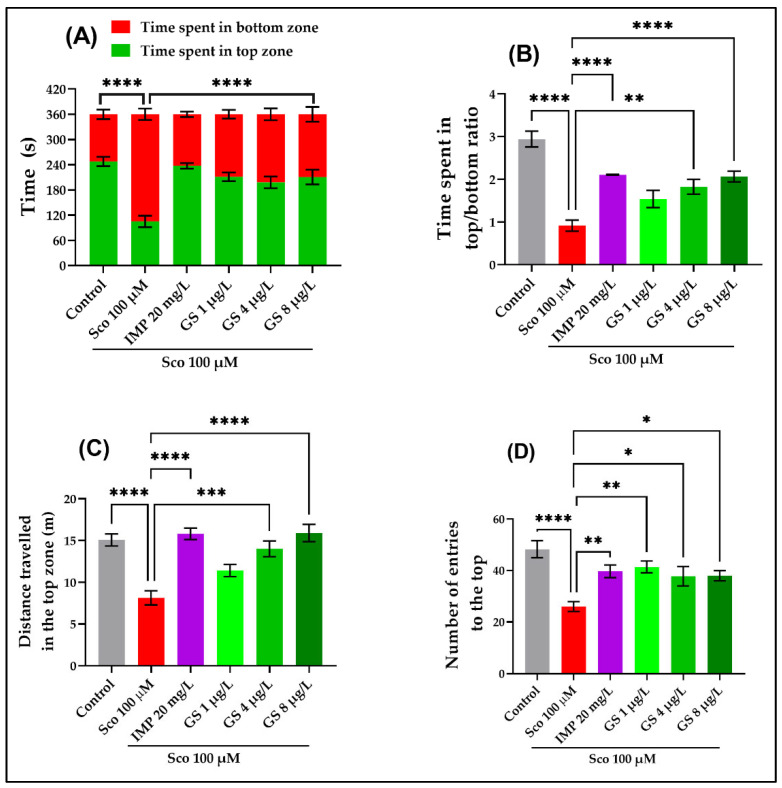
Figure 2.
NTT results for Guiera senegalensis hydroethanolic extract (GS: 1 µg/L, 4 µg/L and 8 µg/L). (A) Time spent in the top/bottom zone. (B) Time spent in top/bottom ratio. (C) Total distance travelled in the top zone. (D) Number of entries to the top zone. Data are expressed as mean ± S.E.M. (n = 10). For Tukey’s post hoc analyses: * p < 0.01, ** p < 0.001, *** p < 0.0001 and **** p < 0.00001.

