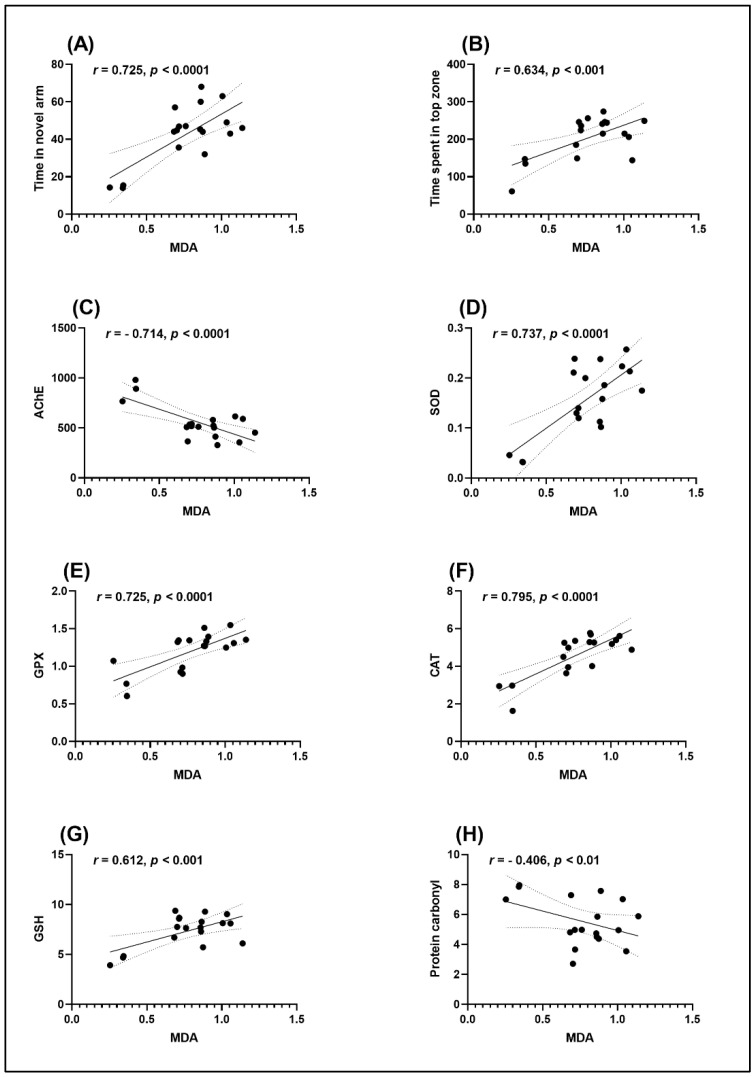
Figure 7.
Correlation analyses between behavioral and biochemical parameters (Pearson’s correlation). Data expressed are time in the novel arm (s), time spent in the top zone (s), AChE (nmol/min/mg protein), SOD (U/mg protein), GPX (U/mg protein), CAT (U/mg protein), GSH (µg GSH/µg protein), protein carbonyl (nmol/mg protein) and MDA (nmol/mg protein). (A) Time in novel arm vs. MDA (n = 10, r = 0.725, p < 0.0001); (B) Time spent in the tope zone vs. MDA (n = 10, r = 0.634, p < 0.001); (C) AChE vs. MDA (n = 10, r = −0.714, p < 0.0001); (D) SOD vs. MDA (n = 10, r = 0.737, p < 0.0001); (E) GPX vs. MDA (n = 10, r = 0.725, p < 0.0001), (F) CAT vs. MDA (n = 10, r = 0.795, p < 0.0001), (G) GSH vs. MDA (n = 10, r = 0.612, p < 0.001) and (H) Protein carbonyl vs. MDA (n = 10, r = −0.406, p < 0.01).

