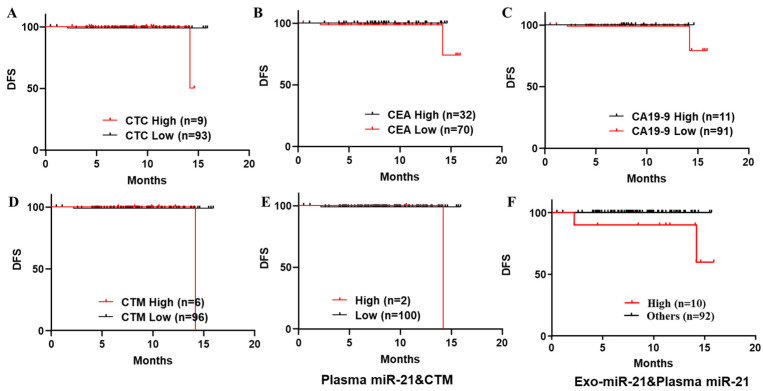
Figure 5.
Kaplan–Meier survival analyses on DFS curves to differentiate recurrence in patients with stage I to III CRC by individual and combined biomarkers. (A–D) DFS curve to differentiate recurrence in patients with stage I to III CRC stratified by numbers of CTC (A), serum CEA level (B), CA19-9 (C) and presence of CTM (D), individually. (E) DFS curve to differentiate recurrence in patients with stage I to III CRC stratified by considering the combination of plasma miR-21 and CTM. (F) DFS curve to differentiate recurrence in patients with stage I to III CRC stratified by considering the combination of plasma and exosomal miR-21.

