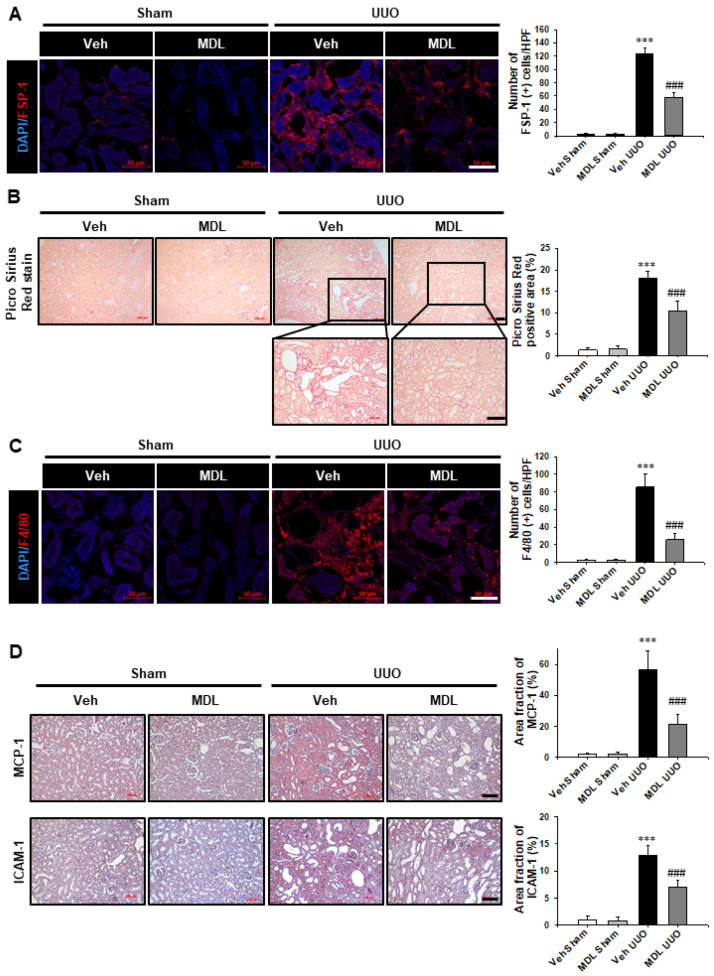
Figure 7.
MDL-800 decreases UUO-induced myofibroblast activation, extracellular matrix deposition, and F4/80 (+) macrophage infiltration. (A) Representative sections of kidneys from sham- and UUO-operated C57/BL6 mice treated with Veh or MDL-800 were immunofluorescence stained with FSP-1 (red). The nucleus was stained by DAPI (blue). Scale bar = 50 μm. The bar graph shows the number of FSP-1 (+) cells in the sham- and UUO-operated kidneys from ten randomly chosen, non-overlapping fields at a magnification of 400× (n = 15 per group). (B) Representative sections of kidneys from sham- and UUO-operated C57/BL6 mice treated with Veh or MDL-800 were stained with Picro Sirius red. Scale bar = 100 μm. The bar graph shows Picro Sirius red positive areas (%) in the sham and UUO kidneys from ten randomly chosen, non-overlapping fields at a magnification of 100× (n = 15 per group). (C) Representative sections of kidneys from sham- and UUO-operated C57/BL6 mice treated with Veh or MDL-800 were immunofluorescence stained with F4/80 (red). The nucleus was stained by DAPI (blue). Scale bar = 50 μm. The bar graph shows the number of F4/80 (+) cells in the sham- and UUO-operated kidneys from ten randomly chosen, non-overlapping fields at a magnification of 400× (n = 15 per group). Data are expressed as mean ± SD. (D) Representative sections of kidneys from sham- and UUO-operated C57/BL6 mice treated with Veh or MDL-800 were stained with MCP-1 and ICAM-1. Scale bar = 100 μm. The bar graph shows area fractions (%) of MCP-1 and ICAM-1 in the sham and UUO kidneys from ten randomly chosen, non-overlapping fields at a magnification of 200× (n = 15 per group). ***, p < 0.001 versus Veh sham or MDL sham; ###, p < 0.001 versus Veh UUO. Sham, sham-operated mice; UUO, unilateral ureteral obstruction; Veh, vehicle; MDL, MDL-800; FSP-1, fibroblast-specific protein-1; MCP-1, monocyte chemoattractant protein-1; ICAM-1, intercellular adhesion molecule-1.

