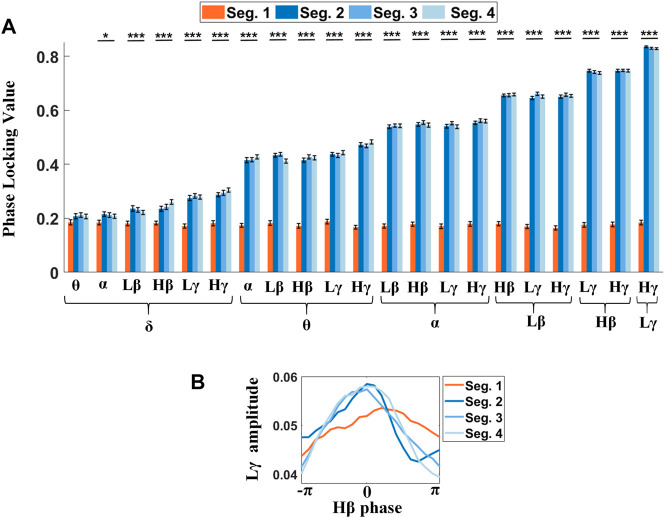
FIGURE 6.
PLVs between the low-frequency phase and the phase of high-frequency amplitude are sensitive to step phases. (A) Significant differences reveal in almost all PLVs across step phases, wherein only the δ-θ PLVs show no significant difference. (B) Phase shifts between the Hβ phase and Lγ amplitude for four different segments (Seg. 1: contralateral heel strike, Seg. 2: the contralateral foot stand, Seg. 3: ipsilateral heel strike, and Seg. 4: ipsilateral foot stand) are shown in the phase-amplitude plot. The orange line shows the phase shift around the contralateral step (Seg. 1), wherein the Lγ activity reaches its peak while the Hβ phase is descending. However, in the Seg. 2-4, the Lγ amplitude modulations keep pace with the Hβ phase (blue lines).

