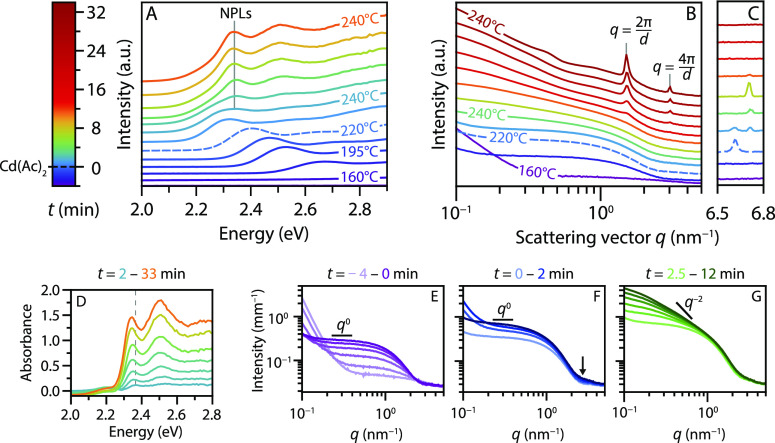
Figure 2.
Absorption spectra (A) and scattering patterns (B,C), shifted for clarity, obtained in situ during the synthesis of CdSe NPLs. The colors of all curves correspond to the times indicated in the legend. Temperature increases from ∼160 to 240 °C and is then kept at 240 °C. Cadmium acetate is added at 220 °C (dashed line, t = 0 min). Blue to cyan absorption spectra show growth of QDs. The absorption features of the NPLs (2.35 eV) become visible shortly after addition of the acetate. The SAXS data also indicate growth of isotropic particles (purple to blue, scattering intensity scaling as q0), followed by growth of NPLs after addition of acetate (blue to red, q0 regime disappears). Structure factor peaks are observed due to stacking of the formed NPLs (d = 2π/q = 4.2 nm). In C, the atomic scattering peak of solid cadmium acetate can be observed. The peak shifts around 230 °C, probably due to a change in the crystal structure. After ∼10 min at 240 °C, the acetate is completely dissolved. (D) The QD absorbance (a spectrum at 230 °C) is subtracted from the data in A. The resulting spectra show the heavy- and light-hole transition of 4.5 ML NPLs at 2.35 and 2.52 eV, respectively, shifted to lower energies compared to room temperature due to temperature effects (see main text). A dashed gray line is added to emphasize the shift of the absorption maximum in the first few frames due to quantum confinement in the lateral dimensions. (E) SAXS patterns until addition of the acetate. (F) SAXS patterns shortly after addition of acetate. The scattering increases at q = 2–3 nm–1, but still, a q0 regime is observed. (G) SAXS patterns 2.5–12 min after the acetate addition, reflecting particle growth at 240 °C. The slope at q < 1 nm–1 becomes steeper than the previous q0 scaling, indicating growth of anisotropic particles.

