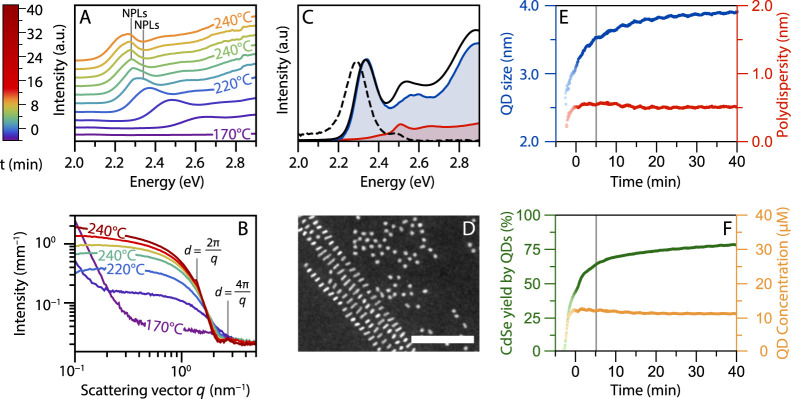
Figure 4.
Absorption spectra (A) and scattering patterns (B) of in situ experiments when no acetate is added to the reaction mixture. In (A), the spectra are shifted in intensity for clarity. The weak absorption features of 4.5 mini-NPLs at 2.34 eV and 5.5 ML mini-NPLs at 2.28 eV are labeled with NPLs for clarity. Features shift to lower energies compared to room temperature due to temperature effects. The structure factor peaks of the stacked 5.5 ML mini-NPLs are labeled in (B) (d = 4.5 nm). (C) Absorption (solid) and emission (dashed) spectra at room temperature of the product obtained during the in situ SAXS experiment. Next to QD absorption and emission (2.3 eV), also a second population of nanoparticles is present: mini-NPLs (2.47 eV). The blue and red curves represent contributions from the supernatant (QDs, blue) and precipitate (predominantly mini-NPLs, red) after selective precipitation. (D) HDAAF-STEM image of the reaction product showing stacked mini-NPLs and QDs, scalebar 50 nm. (E) Diameter (blue) and polydispersity (red) of the QDs extracted from fitting the SAXS data in (B). (F) QD concentration during the reaction (orange) and the reaction yield (green). This yield only accounts for the CdSe consumed by the QDs. The total yield, including the mini-NPLs, is ∼3% higher than the yield in (F). The gray line in (E) and (F) at ∼5 min indicates when the stacking of the mini-NPLs starts to contribute to the total scattering.

