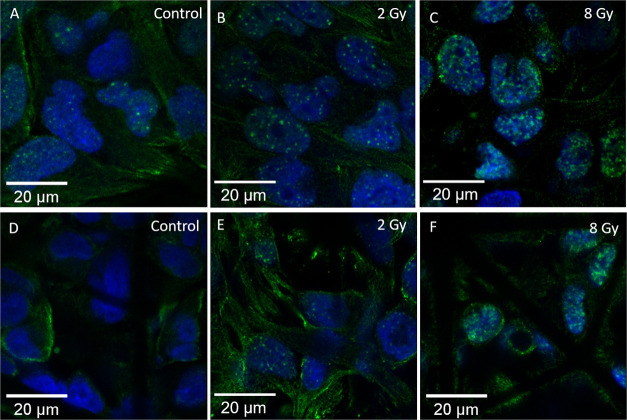
Figure 7.
U-251 cells on 2D pedestals and 3D scaffolds after exposure to different doses of proton radiation. (A–C) Cells on 2D pedestals. (D–F) Cells in the 3D scaffold. (A,D) Control samples. (B,E) 2 Gy samples. (C,F) 8 Gy Samples. The number and density of the foci distinctly increase with the increase in dose. Cells in the 2D configuration have more foci than their 3D counterparts. The control sample in (A) also shows some foci, since DSB damage is not exclusively caused by radiation. The images are taken with a 63× magnification lens (green: Gamma H2A.X, blue: nuclei).

