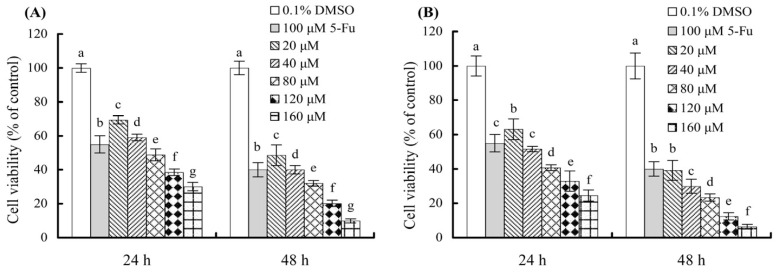
Figure 1.
Measured viability values of the cells treated with 0.1% DMSO, 100 μmol/L 5-Fu, 20–160 μmol/L quercetin (A) and fisetin (B) for 24 and 48 h. Different lowercase letters above the columns of the same treatment time indicate that one-way ANOVA of the mean values is significantly different (p < 0.05).

