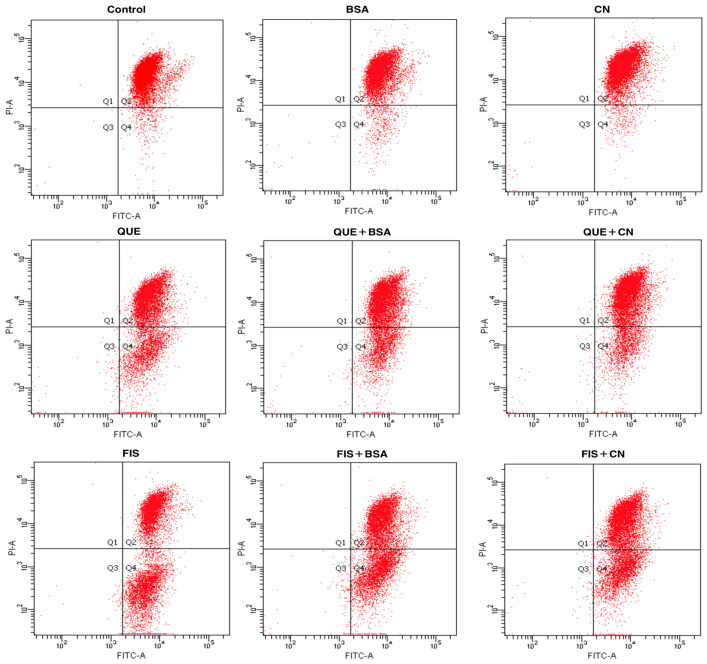
Figure 4.
Flow cytometric results of the mitochondrial potential of the cells treated with 0.1% DMSO (control), quercetin (QUE), fisetin (FIS), bovine serum albumin (BSA), casein (CN), and polyphenol–protein mixtures. Q2 illustrates J-aggregates in functional (polarized) mitochondria that emit red fluorescence, while Q4 illustrates monomers in resting (depolarized) mitochondria that emit green fluorescence. The polyphenol dose was 80 μmol/L, while the protein dose was 1.0 g/L.

