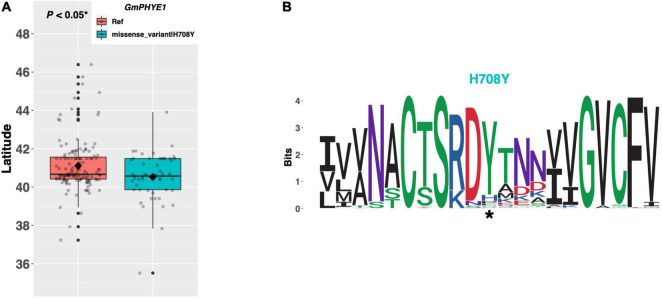
FIGURE 7.
(A) Latitudinal distribution of GmPHYE1 alleles among 187 resequenced ELs with the maturity genotype e1-as/E2. Latitude of origination was used a proxy for relative flowering time. Latitude values were estimated based on state of origin and, where available, were scaled according to maturity info provided by breeders that developed the ELs (see Experimental Procedures). Means comparison was conducted using a student t-test, where the t-statistic representing the 95% confidence interval was empirically derived by randomization. Transparent dots represent the latitude of each accession. Boxplots show the mean (diamond), median (solid line), quartile span (box), range (vertical lines), and outliers (solid dots). Inset legend shows the collection of mutations which make up each allele, where “Ref” refers to the Wm82.a2.v1 reference allele. (B) Weblogo depicting degree of amino acid conservation of the domain surrounding each mutation (asterisk) in GmPHYE1.

