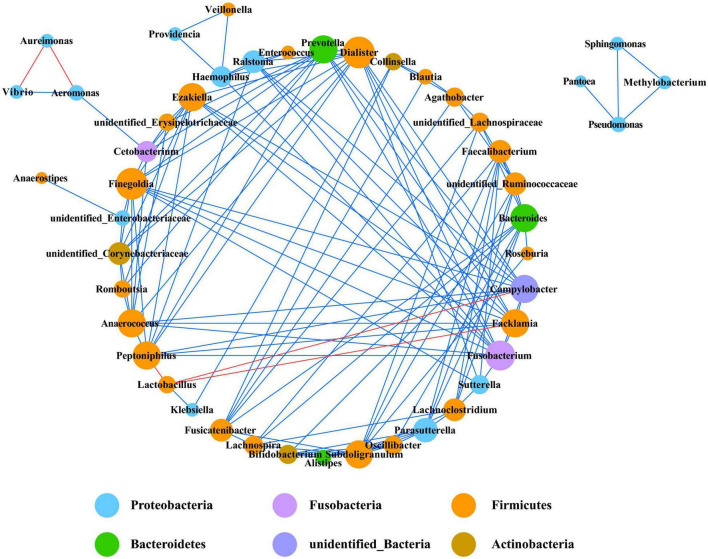
FIGURE 6.
Co-occurrence network of bacteria at genera level. Only p values less than 0.05 and corrections coefficients higher than 0.6 were constructed in the network. The size of each node is proportional to the number of connections, the color of each node is correlates with taxonomy. Blue edges indicate positive correlations, and red edges indicate negative correlations.

