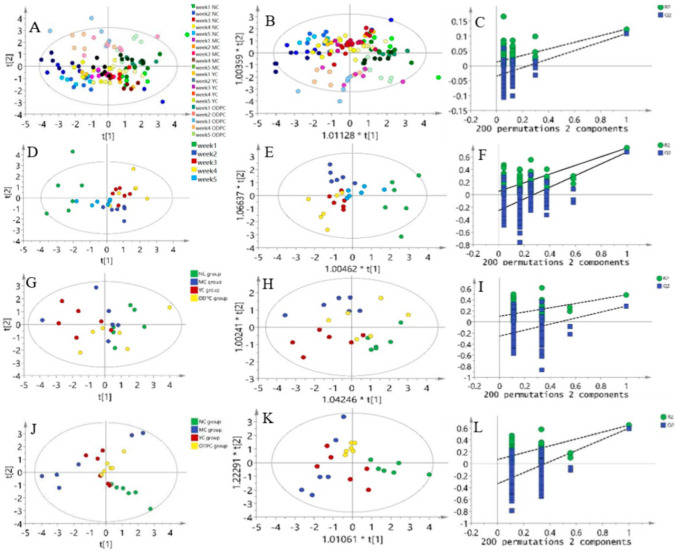
Figure 8.
Results of the multivariate statistical analysis of the ODP time dependence study: (A) PCA score chart of peripheral blood; (B) OPLS-DA score plot of peripheral blood; (C) OPLS-DA replacement test diagram of peripheral blood; (D) PCA score chart of oral ODP for 35 days; (E) OPLS-DA score chart of oral ODP for 35 days; (F) OPLS-DA replacement test chart of oral ODP for 35 days; (G) PCA score chart of oral ODP for 7 days; (H) OPLS-DA score chart of oral ODP for 7 days; (I) OPLS-DA replacement test chart of oral ODP for 7 days; (J) PCA score chart of oral ODP for 28 days; (K) OPLS-DA score chart of oral ODP for 28 days; (L) OPLS-DA replacement test chart of oral ODP for 28 days. NC: normal control group. MC: CdCl2-treated group. YC: positive-treated group. ODPC: ODP-treated group.

