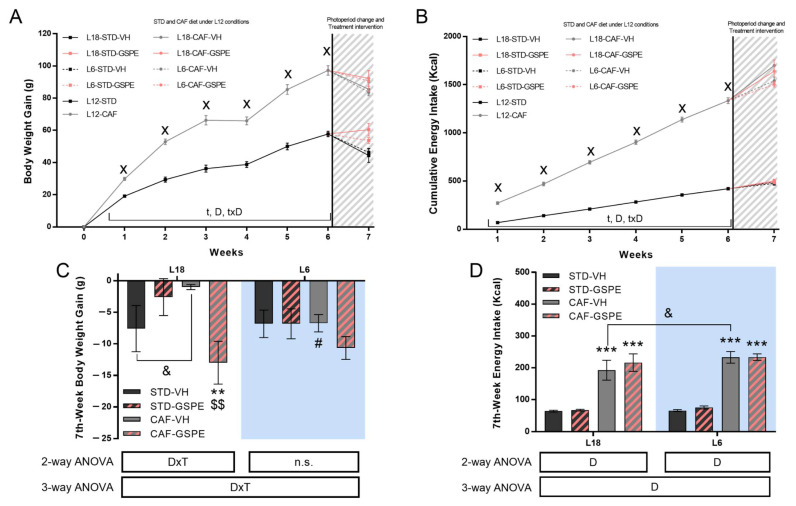
Figure 2.
Body weight gain and cumulative food intake. (A) Body weight gain and (B) Cumulative energy intake over the experiment. (C) Body weight gain in the seventh week for L18 and L6 conditions and (D) Cumulative energy intake for L18 and L6 conditions (STD-VH, STD-GSPE, CAF-VH, and CAF-GSPE) in the seventh week. Values are expressed as the mean ± S.E.M. (n = 24 for L12 groups and n = 6 for L18 and L6 groups). x Indicates significant differences using repeated measured-ANOVA followed by a Student’s t-test between L12-STD vs. L12-CAF (p ≤ 0.001). D, diet effect; DxT, interaction between treatment and Diet; t, time effect; txD, interaction between time and diet effect. n.s., no significant differences. ** or *** Indicate significant differences by diet effect (p ≤ 0.01 and p ≤ 0.001, respectively), $$ Indicates significant differences by treatment effect (p ≤ 0.01), # Indicates significant differences by photoperiod effect using 2-way and 3-way ANOVA followed by a LSD post-hoc test (p ≤ 0.05). & Indicates tendency using a LSD post-hoc test (p = 0.1–0.051). STD, Standard diet-fed rats; CAF, Cafeteria diet-fed rats; VH, rats administered vehicle; GSPE, rats administered 25 mg/kg grape seed proanthocyanidin-rich extract; L12, standard photoperiod 12 h light per day; L18, long photoperiod 18 h light per day; L6, short photoperiod 6 h light per day. The blue background corresponds to the groups under L6 conditions.

