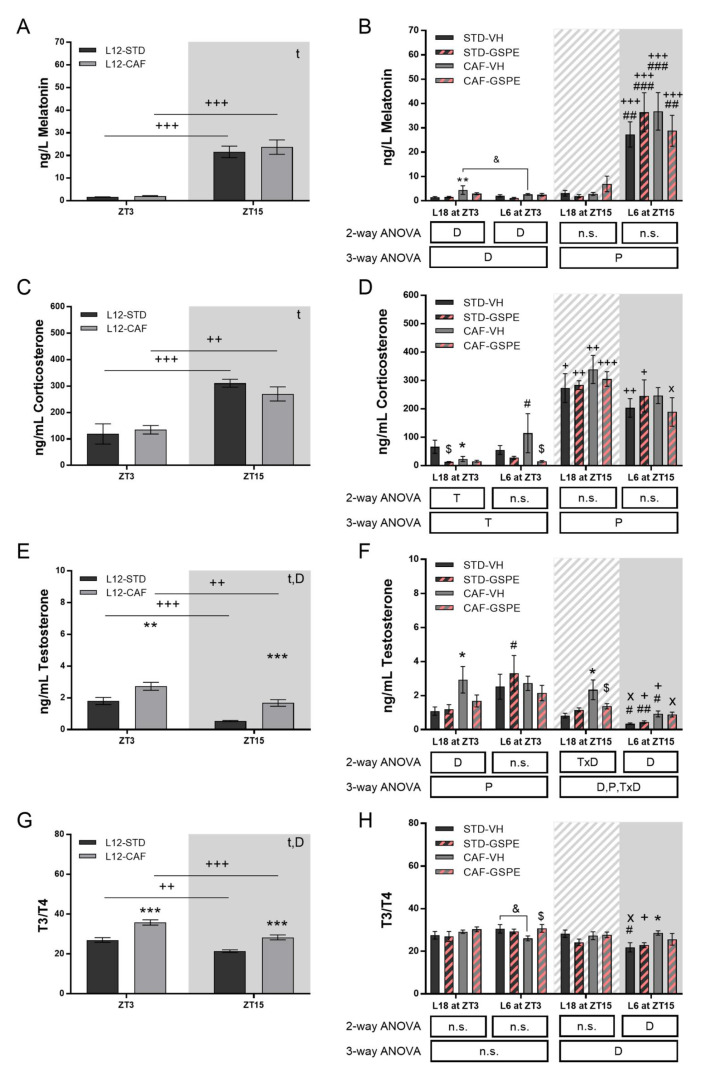
Figure 6.
Serum hormones of STD- and CAF-fed rats in the sixth week of the experiment under L12 conditions and in the seventh week of the experiment under L18 and L6 conditions. Serum melatonin at ZT3 and ZT15 (A) in L12 and (B) L18 and L6 conditions. Serum corticosterone at ZT3 and ZT15 (C) in L12 and (D) L18 and L6 conditions. Serum testosterone at ZT3 and ZT15 (E) in L12 and (F) L18 and L6 conditions. Serum T3-to-T4 ratio at ZT3 and ZT15 (G) in L12 and (H) L18 and L6 conditions. Values are expressed as the mean ± S.E.M. (n = 6). D, diet effect; T, GSPE treatment effect; P, photoperiod effect; TxD, interaction between treatment and diet; DxP, interaction between diet and photoperiod; n.s., no significant differences. *, ** or *** Indicate significant differences by diet effect (p ≤ 0.05, p ≤ 0.01 and p ≤ 0.001, respectively), $ Indicate significant differences by treatment effect (p ≤ 0.05, respectively), #, ## or ### Indicate significant differences by photoperiod effect (p ≤ 0.05, p ≤ 0.01 and p ≤ 0.001, respectively) using 2-way and 3-way ANOVA followed by a LSD post-hoc test (p ≤ 0.05). & Indicates tendency using a LSD post-hoc test (p = 0.1–0.051). +, ++ or +++ Indicate significant differences using a paired Student’s t-test between ZT3 vs. ZT15 for each group (p ≤ 0.05, p ≤ 0.01 and p ≤ 0.001, respectively). x Indicates tendency using a paired Student’s t-test between ZT3 vs. ZT15 for each group (p = 0.1–0.051). AUC, Area under curve; GSPE, grape seed proanthocyanidin-rich extract, STD, Standard diet-fed rats; CAF, Cafeteria diet-fed rats; VH, rats administered vehicle; GSPE, rats administered 25 mg/kg GSPE; L12, normal photoperiod 12 h light per day; L18, long photoperiod 18 h light per day; L6, short photoperiod 6 h light per day. Grey background, dark phase. slash background, transitions phase.

