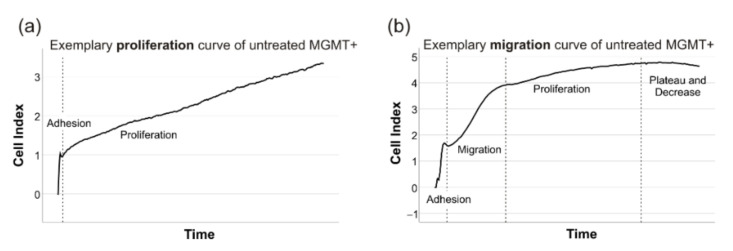
Figure 7.
The exemplary xCELLigence curves to determine the proliferation and migration. The cells’ proliferation was measured by determining the mean doubling time after the adhesion period and while the cell index displayed the characteristic constant linear slope (a). Similarly, the cells’ migration rate was determined in CIM-plates by measuring the cell index’s slope in a timeframe after the adhesion period had taken place and before cells reached a linear constant slope resembling proliferation (b).

