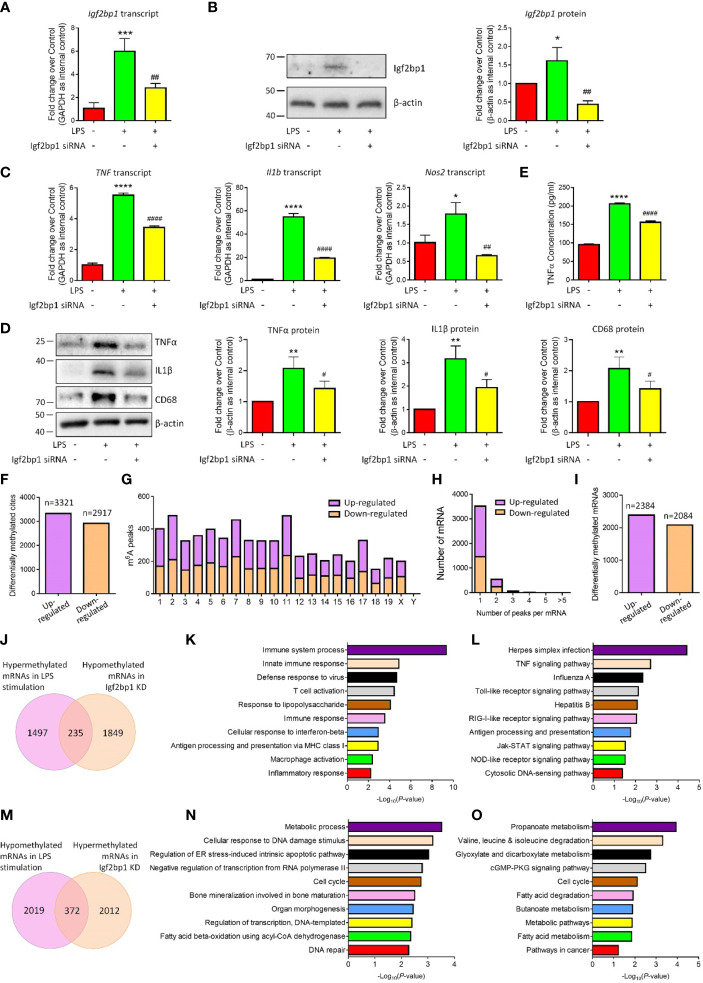
Figure 3.
Igf2bp1 regulates the inflammatory responses and m6A modifications of microglia. (A) Expression of Igf2bp1 mRNAs in LPS-stimulated microglia after knocking down Igf2bp1 expression was determined by qRT-PCR. (B) Expression of Igf2bp1 proteins in LPS-stimulated microglia after knocking down Igf2bp1 expression was determined by western blotting. (C) Expression of TNF, Il1b, and Nos2 mRNAs in LPS-stimulated microglia after knocking down Igf2bp1 expression was determined by qRT-PCR. (D) Expression of TNFα, IL1β, and CD68 proteins in LPS-stimulated microglia after knocking down Igf2bp1 expression was determined by western blotting. (E) The release of TNFα from LPS-stimulated microglia after knocking down Igf2bp1 expression was determined by ELISA assay. (F) The numbers of significantly altered m6A peaks after knocking down Igf2bp1 expression in LPS-stimulated microglia. (G) The distributions of altered m6A peaks in human chromosomes. (H) The distribution of altered m6A peaks per mRNA. (I) The numbers of mRNAs with significantly altered m6A peaks after knocking down Igf2bp1 expression in LPS-stimulated microglia. (J) Venn diagrams for genes with m6A hypermethylation after LPS treatment and m6A hypomethylation post Igf2bp1 LOF. (K) The top 10 GO terms of genes with m6A hypermethylation after LPS treatment and m6A hypomethylation post Igf2bp1 LOF. (L) The top 10 KEGG pathways of genes with m6A hypermethylation after LPS treatment and m6A hypomethylation post Igf2bp1 LOF. (M) Venn diagrams for genes with m6A hypomethylation after LPS treatment and m6A hypermethylation post Igf2bp1 LOF. (N) The top 10 GO terms of genes with m6A hypomethylation after LPS treatment and m6A hypermethylation post Igf2bp1 LOF. (O) The top 10 KEGG pathways of genes with m6A hypomethylation after LPS treatment and m6A hypermethylation post Igf2bp1 LOF. Data were represented as mean ± s.d. from three independent experiments. *, **, ***, and **** denote p < 0.05, p < 0.01, p < 0.001, and p < 0.0001, respectively, in comparison with control microglia. #, ##, and #### denote p < 0.05, p < 0.01, and p < 0.0001, respectively, in comparison with LPS-stimulated microglia.

