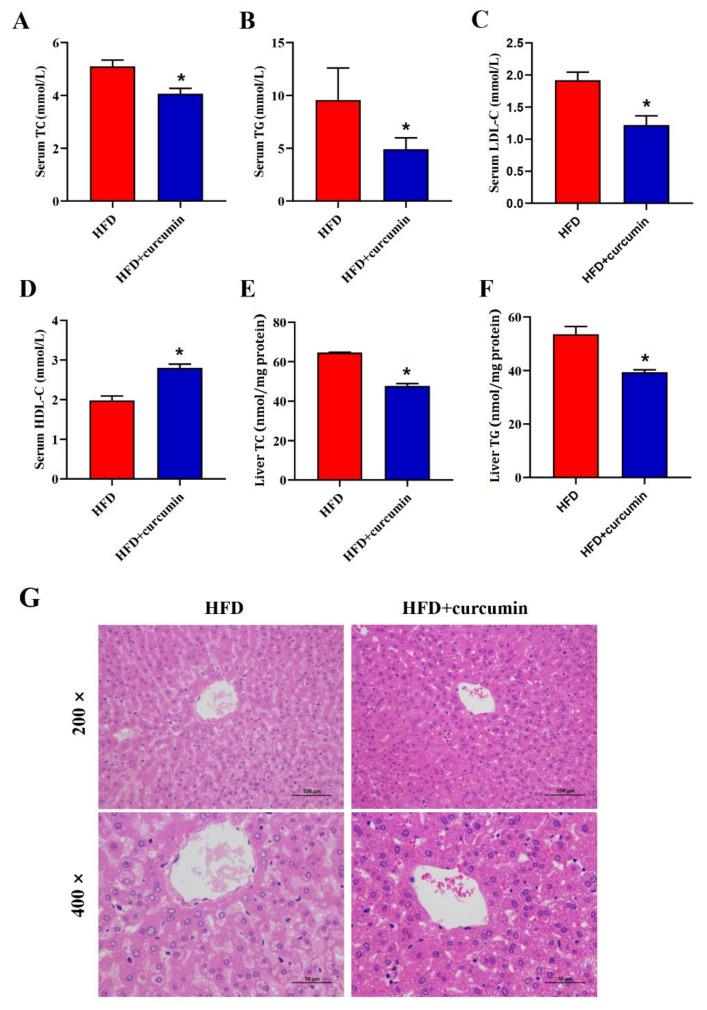
Figure 3.
Effects of curcumin on serum and liver lipid metabolism in HFD-fed hamsters. (A–D) The serum TC, TG, LDL-C, HDL-C levels; (E,F) The liver TC, TG levels; (G) Representative H&E staining graphs of liver (200× magnifications, 400× magnifications). Data are expressed as mean ± SEM (n = 8), * p < 0.05 compared to HFD group. TC, Total cholesterol; TG, Total triglycerides; LDL-C, Low-density lipoprotein cholesterol; HDL-C, High-density lipoprotein cholesterol.

