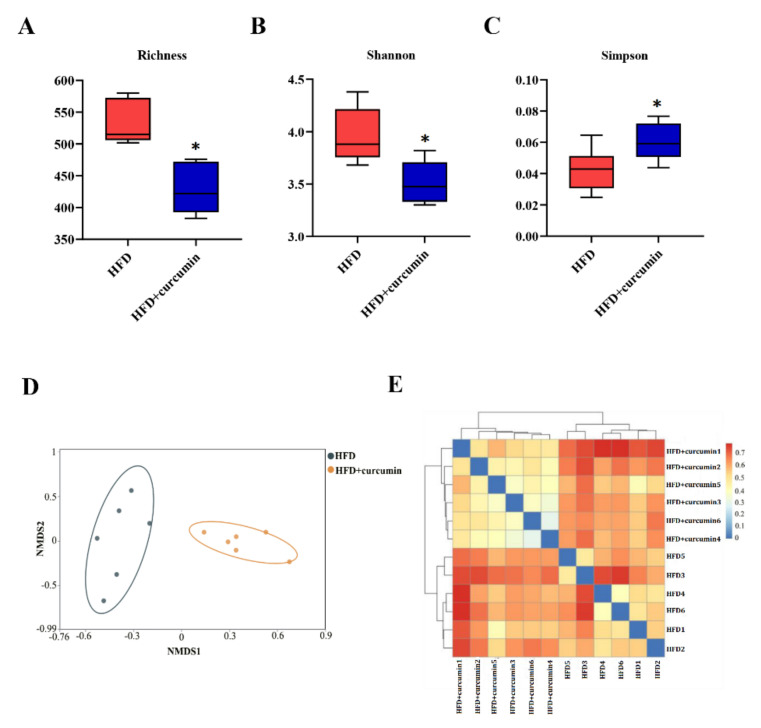
Figure 4.
Effects of curcumin on gut microbiota composition in HFD-fed hamsters. (A–C) α-diversity analysis including richness, Shannon index and Simpson index of gut microbiota. (D,E) β-diversity analysis of gut microbiota including NMDS plot and sample distance heat map. Data are expressed as mean ± SEM (n = 6), * p < 0.05 compared to HFD group.

