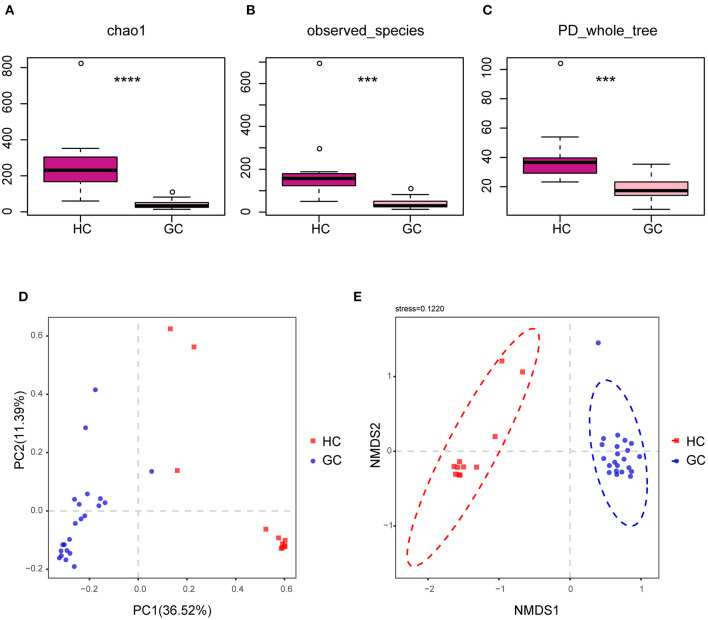
Figure 2.
Altered bacterial microbiota biodiversity in GC. (A–C) Alpha diversity. Chao1, observed_species, and PD_whole_tree describe the alpha diversity of the fungi in GC and HC groups (Tukey test, ***p < 0.001; ****p < 0.0001). (D,E) Principal coordinate analysis of Bray–Curtis distance with each sample colored according to different groups. PC1 and PC2 represent the top two principal coordinates that captured most of the diversity. The fraction of diversity captured by the coordinate is given as a percentage. Groups were compared using the PERMANOVA method.

