Figure 3.
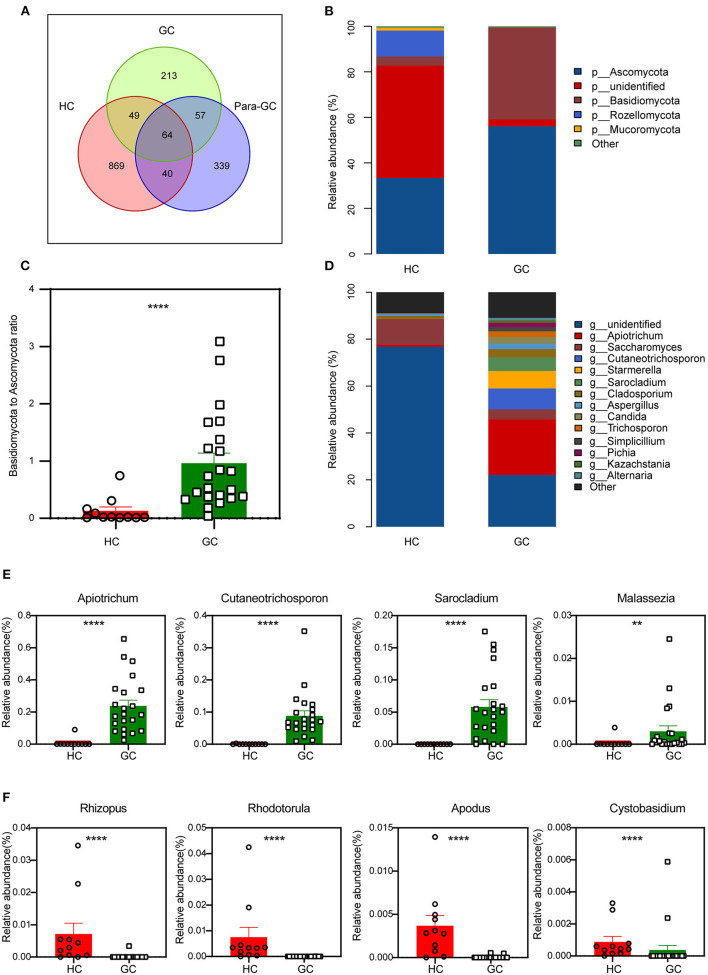
Changes of the fungal composition. (A) Venn diagram analysis according to the operational taxonomic unit abundance among the three groups. (B) Comparisons of the relative abundance of dominant fungal taxa at the phylum level, “p” represents phylum. (C) The ratio of Basidiomycota to Ascomycota relative abundance between the two groups (Mann-Whitney U test, ****p < 0.0001). (D) Comparisons of the relative abundance of dominant fungal taxa at the genus level, “g” represents genus. (E,F) The differentially abundant fungal genus of GC-enriched (E) and HC-enriched (F) between HC and GC groups (Mann-Whitney U test, **p < 0.01; ****p < 0.0001).

