Figure 2.
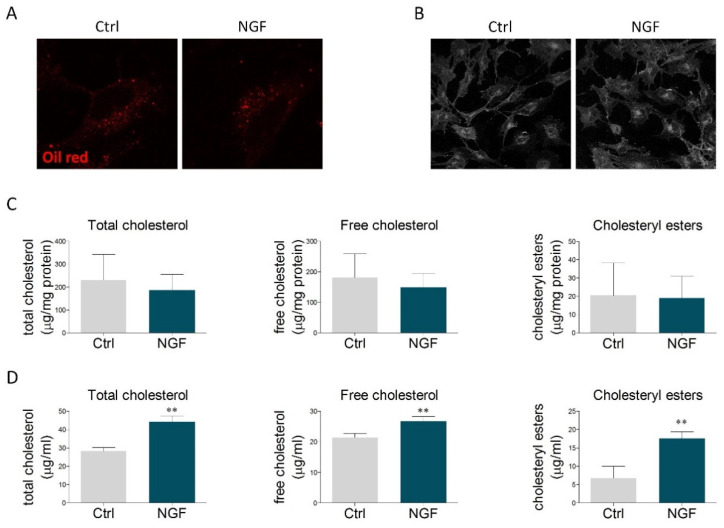
NGF effects on neutral lipids and cholesterol content. (A) U373 cells were treated with vehicle (Ctrl) or NGF (100 ng/mL) for 48 h and then stained with Oil Red O to visualize the intracellular content of neutral lipids. n = 3 different experiments. (B) Representative image of filipin staining performed on U373 cells treated with vehicle (Ctrl) and NGF (100 ng/mL) for 48 h. n = 3 different experiments. (C) Quantification of intracellular cholesterol levels (total cholesterol, free cholesterol, and cholesteryl esters) in vehicle- and NGF-treated U373 cells. n = 3 different experiments. (D) Cholesterol quantification (total cholesterol, free cholesterol, and cholesteryl esters) in the culture medium of U373 cells treated with vehicle (Ctrl) and NGF (100 ng/mL) for 48 h. n = 3 different experiments. Data represent means ± SD. Statistical analysis was performed by using unpaired Student’s t-test. ** p <0.01.

