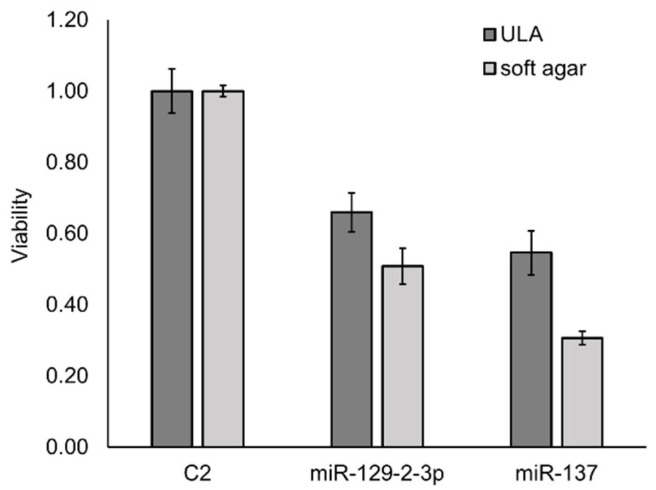
Figure 1.
ULA plates show similar growth reduction compared to soft-agar assays. Bar graph demonstrating comparable results for a cell viability assay using ULA plates and colony counts in a soft-agar assay for SiHa cells ectopically expressing miR-129-2-3p or miR-137, relative to negative control C2. The standard error was calculated based on at least two measurements.

