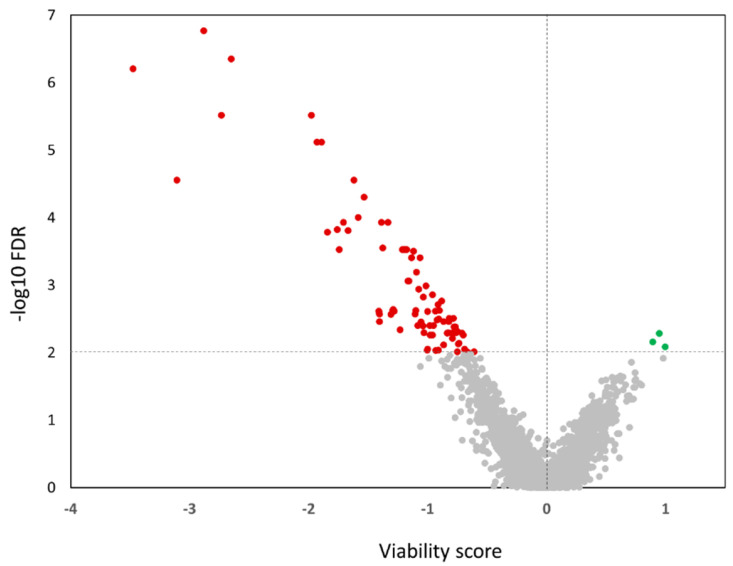
Figure 2.
Volcano plot of viability scores in SiHa cells. The x-axis specifies the difference in viability scores, and the y-axis specifies the negative logarithm to the base 10 of the FDR. The horizontal dashed red line indicates the selection threshold: FDR < 0.01. miRNA hits with decreased and increased viabilities are marked red and green, respectively.

