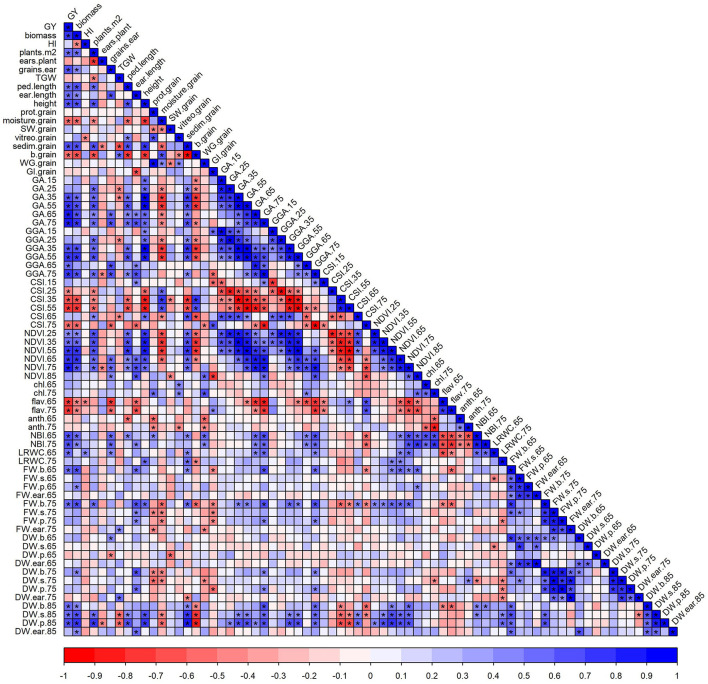
Figure 4.
The correlation matrix of agronomic components and grain quality and physiological traits. Each point of the matrix is a Pearson correlation coefficient between two traits (blue, positive correlation; red, negative correlation). Asterisks indicate a significant correlation (p < 0.05). The abbreviations are described in Supplementary Table 1.

