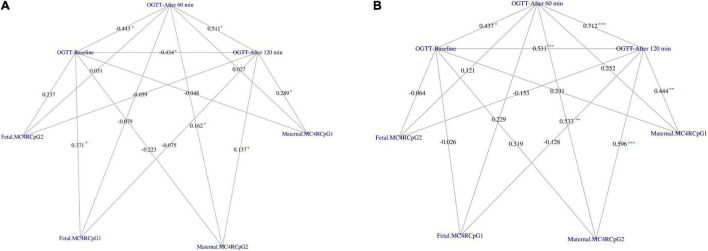
FIGURE 1.
Correlation network between OGTT glucose concentration at baseline, after 60 min and after 120 min with the CpG1 and CpG2 at the maternal and fetal side of placenta in GDM (A) and Controls (B), respectively. The weight on the edges indicates the Spearman rank correlation coefficient (rho), the red color star indicates statistically significant correlation coefficient. Significance code: “*” = p < 0.050, “**” = p < 0.010, “***” = p < 0.001.

