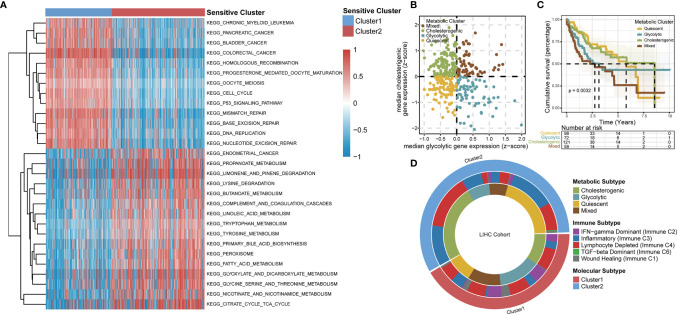
Figure 4.
TTK patterns vary with respect to the metabolic microenvironment. (A) GSVA enrichment analysis disclosing biological pathway differences between TTK patterns. The heatmap was generated to visualize these biological processes; red represents activated pathways and blue represents inhibited pathways. (B) Scatter plot showing median expression levels of co-expressed glycolytic (x-axis) and cholesterogenic (y-axis) genes in each HCC sample. Metabolic subgroups were assigned on the basis of the relative expression levels of glycolytic and cholesterogenic genes. (C) Kaplan–Meier survival analysis of patients with HCC stratified by four metabolic subtypes clustered by glycolytic and cholesterogenic genes. (D) Circle diagram shows HCC subtypes for each sample and investigated their degree of overlap with TTK patterns, immune subtypes and metabolic phenotypes.

