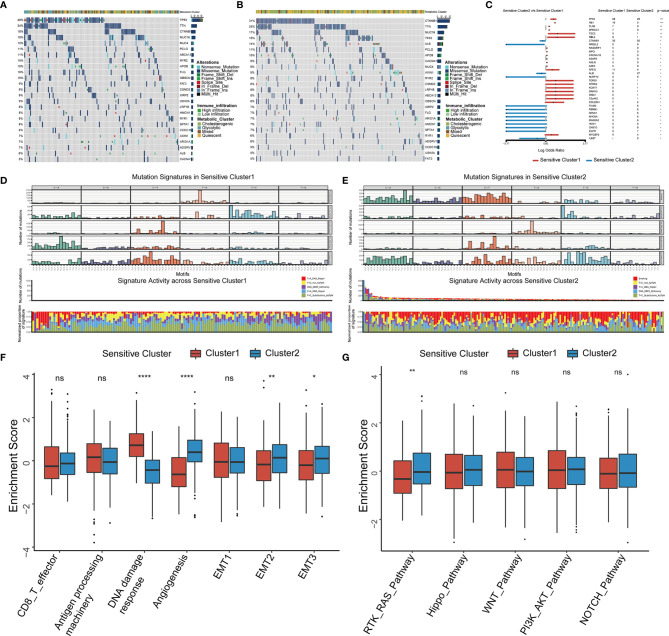
Figure 5.
Somatic mutations, mutational signatures, and related signaling pathways for the TTK patterns. (A, B) Waterfall plots revealing the somatic mutation distributions of the 25 genes with the highest mutation frequencies in Cluster 1 (A) and Cluster 2 (B). (C) Forest plot showing differentially mutated genes in the two clusters. (D, E) Upper panel, Bayesian NMF was used to identify five mutational signatures in Cluster 1 (D) and Cluster 2 (E). The y-axis shows the number of mutations of each type in each specific sequence. The middle and lower panels show the total number of mutations associated with five mutational signatures (middle) and relative proportion of mutation types (lower panels) in each TTK pattern. (F, G) Differences in signaling pathways involved in patterns of TTK based on gene sets related to stromal-activated pathways and oncogenic signaling cascades. The upper and lower ends of the boxes indicate the interquartile range. Lines in the boxes represent median values, and black dots show outliers. *p < 0.05; **p < 0.01; ***p < 0.001; ****p < 0.0001; ns, no statistical significance.

