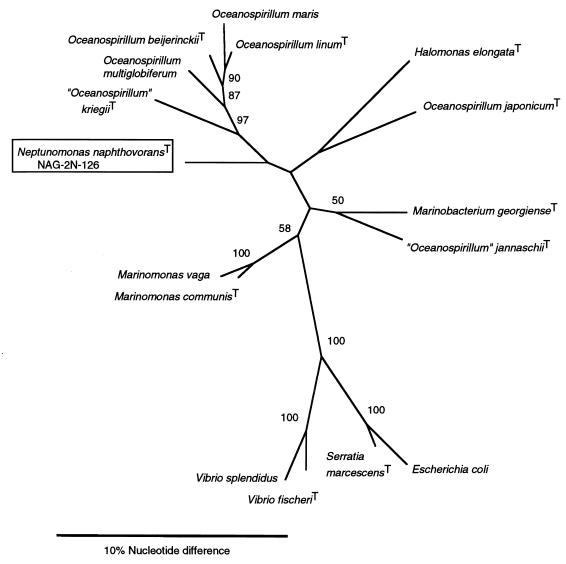
FIG. 3.
16S rDNA phylogenetic analysis of N. naphthovorans NAG-2N-126 and with other members of the gamma-3 subgroup of the Proteobacteria. The numbers at the branch nodes are bootstrap values based on 100 resamplings for maximum likelihood. Only bootstrap values greater than 50% are shown. Scale bar = approximately 10% nucleotide divergence. T = type strain.

