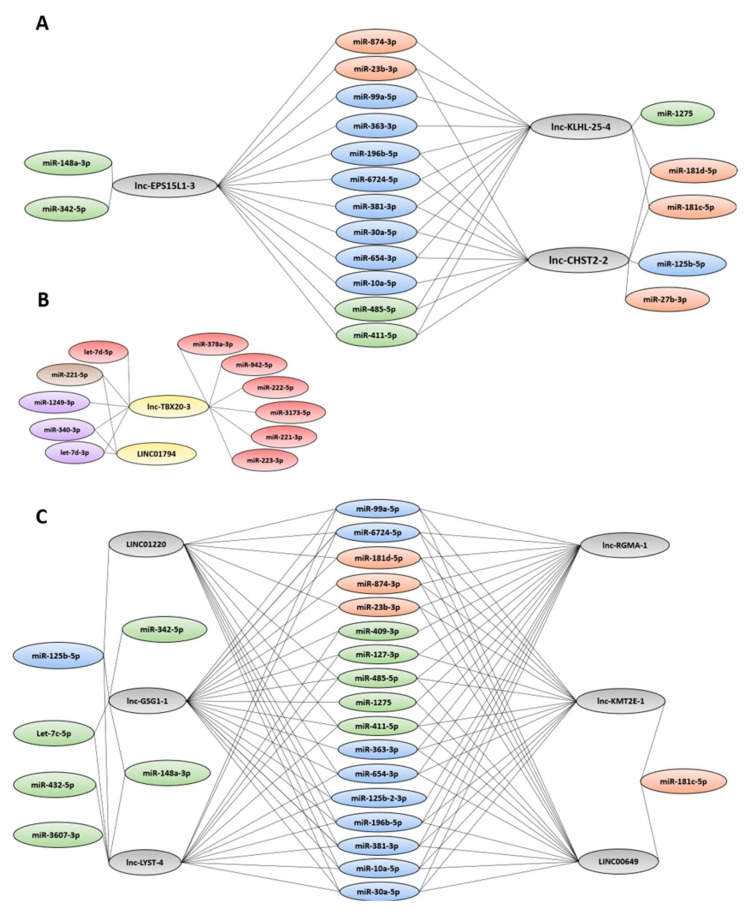
Figure 5.
Network of up- (A) and downregulated (B) LSC DE-lncRNAs and shared DE-lncRNAs (C) with anti-correlated miRNAs. Up- and downregulated DE-lncRNAs are represented in grey and yellow, respectively. The anti-correlated miRNAs that are differentially downregulated (|logFC| ≤ 2, Adj. p value ≤ 0.05) in the LSCs, the L-blasts, and the LSCs as L-blasts, in this respective order, are visualized in orange, green, and blue. Upregulated (logFC ≥ 2, Adj. p value ≤ 0.05) DE-miRNAs in the LSCs, L-blasts, and LSCs as L-blasts are visualized in purple, red, and brown respectively.

