Figure 5.
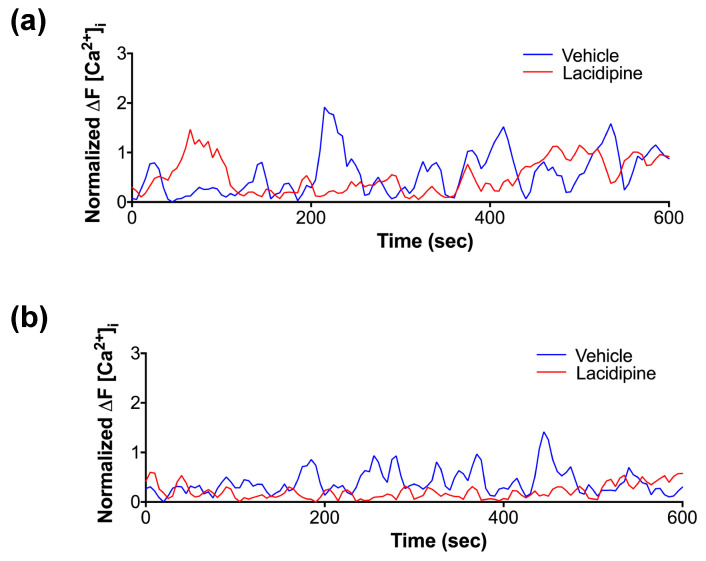
Ca2+ imaging to detect the endogenous intracellular changes of Ca2+ at early and late stages of tube formation. To monitor the intracellular temporal Ca2+ dynamics, HUVEC were stably infected with genetically encoded Ca2+ FRET sensor (GCaMP) using a lentiviral vector. Cells were time-lapse imaged using the high-content imaging system (Operetta) with 20× objective at 5 s intervals for 10 min. The fluorescent signal was quantified using Harmony imaging software. For each individually tracked cell, a spherical region of interest to avoid overlapping with adjacent cells. The mean fluorescent intensity of all cells at every time point was normalized to the baseline fluorescent intensity of GCaMP6. The graph traces are representative of three independent experiments. A total of 25–40 cells were included in the quantification for each experiment. (a) Representative traces illustrating a pattern of repeated iCa2+ spikes in HUVEC at an early stage (1 h) of the angiogenesis assay. (b) Representative traces showing that the generated iCa2+ spikes in the presence of Lacidipine (5 μM) for 24 h.

