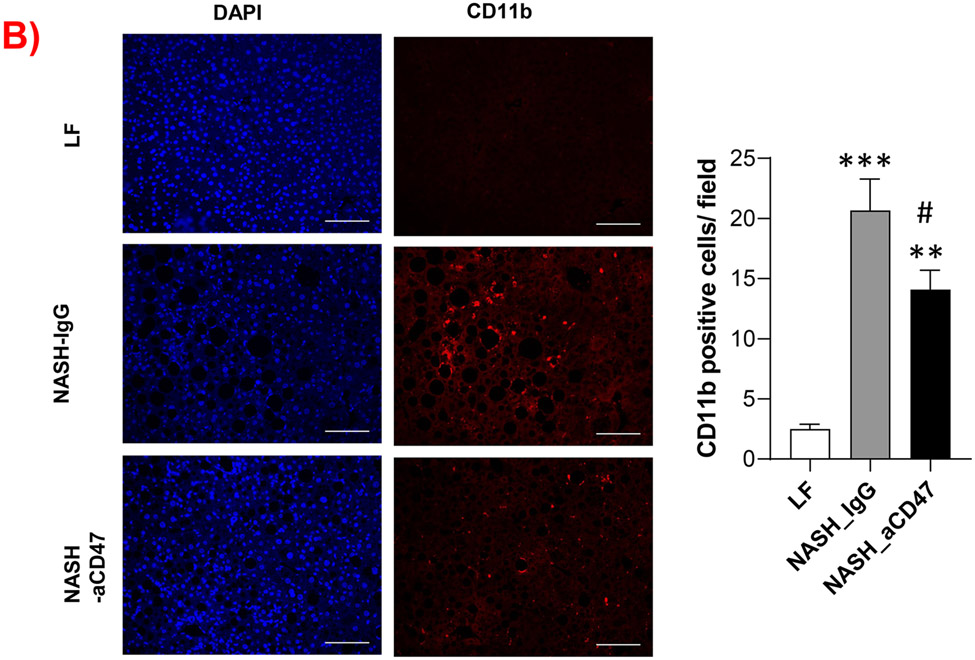
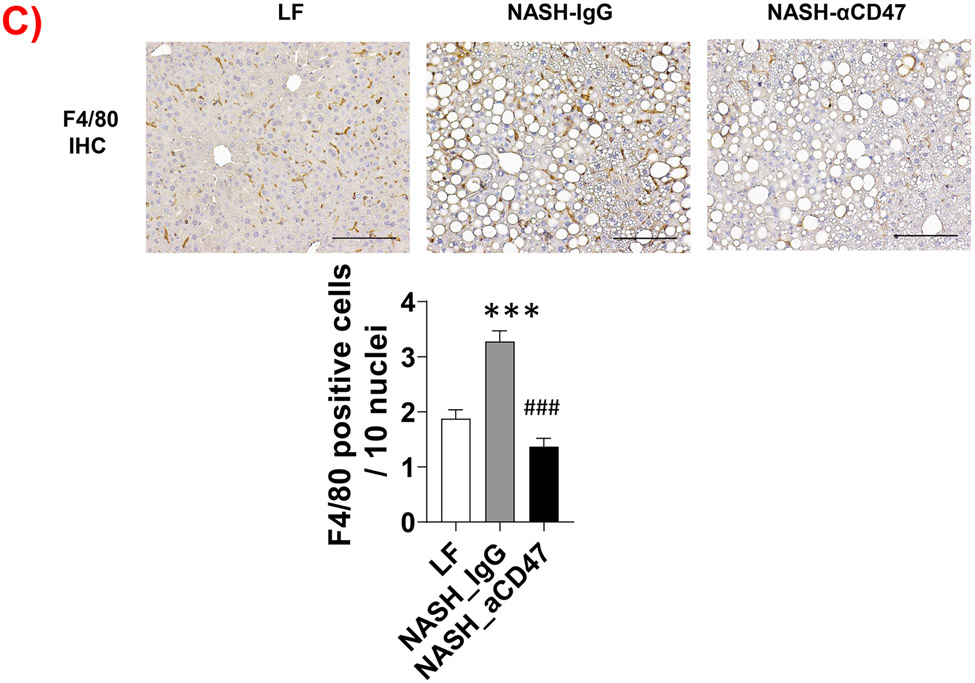
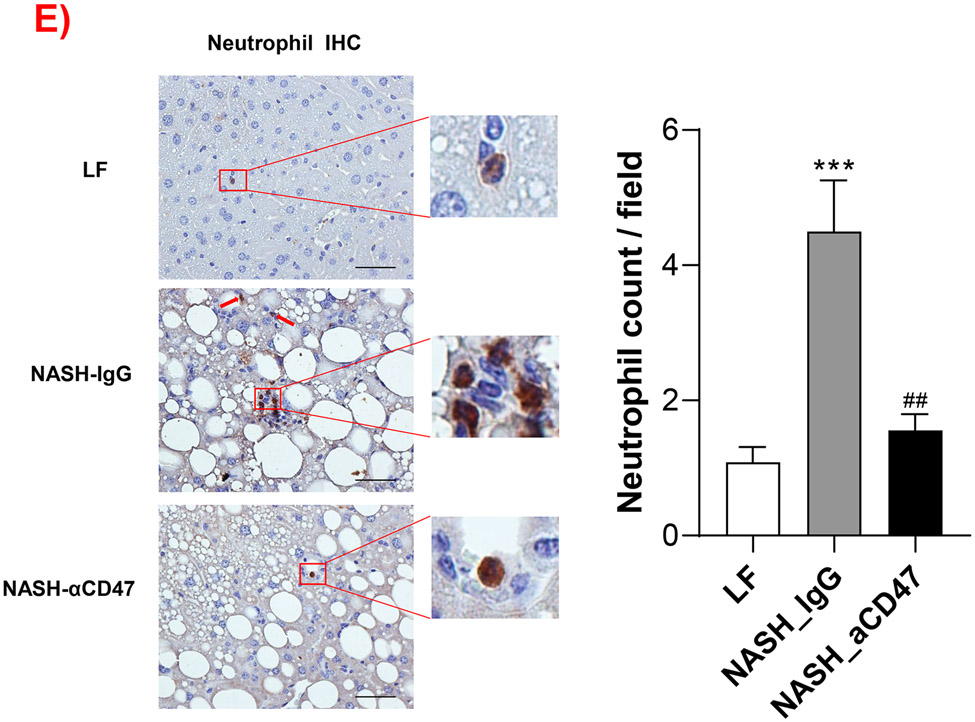
Fig. 3. Anti-CD47 antibody treatment attenuated AMLN diet-induced hepatic inflammation.
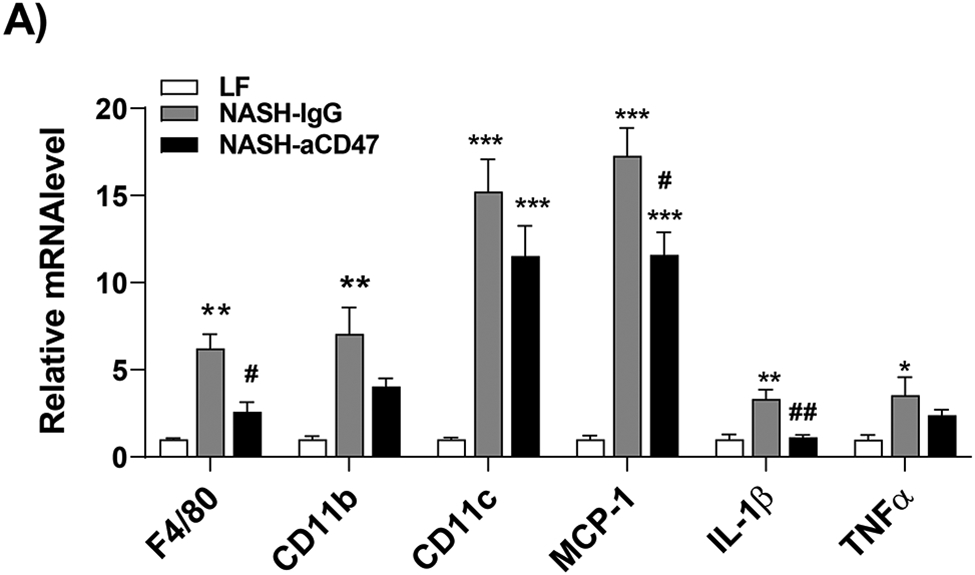
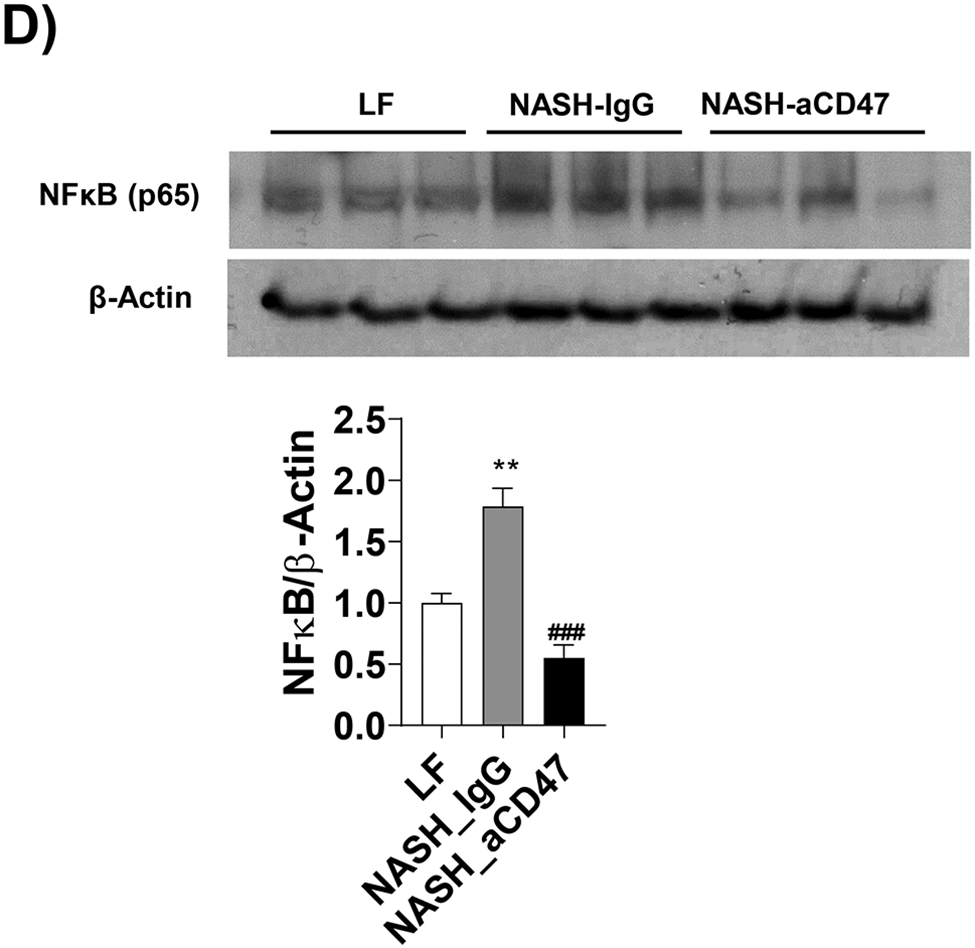
(A) Hepatic inflammatory gene expression in liver by qPCR; (B) Representative liver immunofluorescent images (Blue=DAPI; Red=CD11b; Scale bar=100 μm) and the quantification data; (C) Representative liver immunohistochemical staining images for F4/80 (positive staining shown as brown color; Scale bar=100 μm) and the quantification data; (D). Western blotting and quantification of liver NF-κB/p65 levels normalized to β-actin levels. (E) Representative images for liver immunohistochemical staining of neutrophils from 3 groups of mice (positive staining shown as brown color, Scale bar=50 μm) and the quantification data. Data are represented as mean ± SEM (n=8 mice/group). *P<0.05, ** P<0.01, and *** P<0.001 compared to LF; #P<0.05, ##P <0.01, and ###P<0.001 compared to NASH-IgG;

