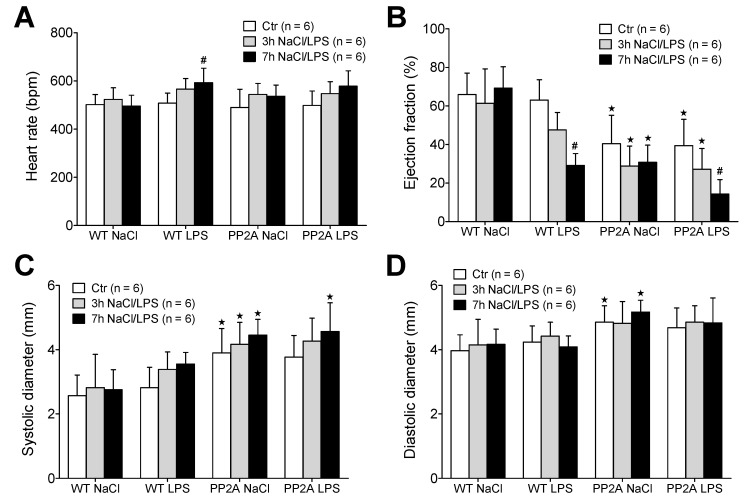
Figure 3.
Echocardiography after LPS. Measurement of echocardiographic parameters of wild type (WT) and PP2A overexpressing mice before (Ctr) and 3 and 7 h after intraperitoneal application of LPS (25 mg/kg) or NaCl solution as solvent control. (A) Heart rate, (B) ejection fraction, (C) maximal systolic cardiac diameter of the left ventricle, (D) maximal diastolic cardiac diameter of the left ventricle of the heart. First bars always indicate basal conditions (before application of LPS), second bars indicate three hours after application of LPS or solvent control (NaCl). Third bars indicate seven hours after application of LPS or solvent control (NaCl). Numbers in brackets indicate the number of experiments. ★ p < 0.05 vs. WT; # p < 0.05 vs. NaCl.

