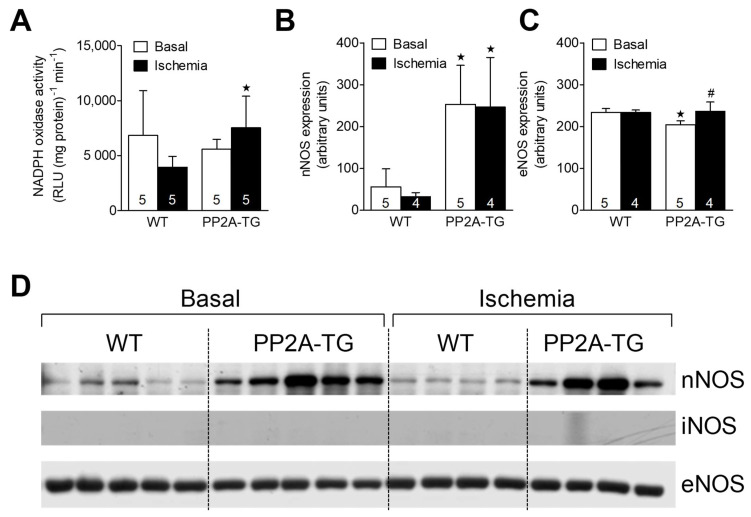
Figure 7.
The cardiac activity of NADPH oxidase is plotted in (A). Western blot data for the expression of neuronal (B) and endothelial (C) nitric oxidase synthase (nNOS and eNOS) in the hearts from WT and PP2A-TG are plotted. The open bars indicate basal perfusion conditions and filled bars indicate values at the end of the ischemia. Original nitrocellulose membranes are shown in (D) for expression of nNOS (upper tracing) or eNOS (lower tracing), before ischemia (basal, left-hand side) and after 120 min of ischemia (right-hand side). The inducible NOS (iNOS) was not detectable by Western blotting (middle tracing). In the supplementary Figure S7, the corresponding fast green stained membranes are shown to demonstrate equal protein loading. The data for nNOS and eNOS are summarized as means and SD for 4–5 hearts and are presented in bar diagrams in (B,C). ★ p < 0.05 vs. WT, # p < 0.05 vs. basal conditions.

