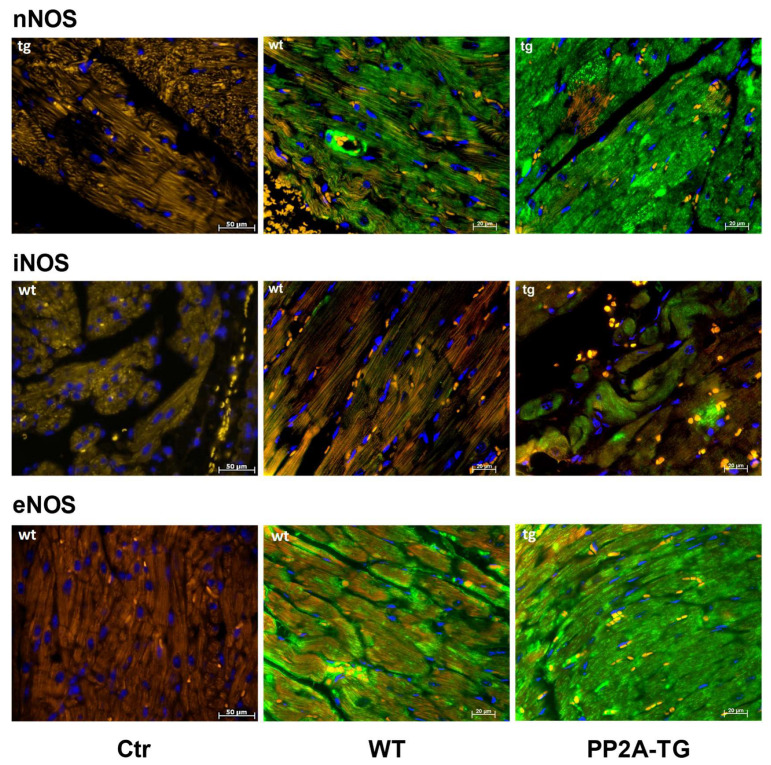
Figure 8.
Immunohistochemical detection of NOS1 (nNOS), NOS2 (iNOS), and NOS3 (eNOS) in ventricular tissue sections from wild type (WT) and PP2A transgenic mice (TG). Controls (Ctr) are samples with omission of the first antibody. Bars in the lower right angle of the photographs indicate the length markers in micrometers (µm). Nitric oxide synthase (NOS) isoforms are stained in green. Nuclei are counterstained in blue with DAPI (4′,6-diamidino-2-phenylindole). Red blood cells appear yellow colored due to autofluorescence. Note the differences in NOS expression between WT and TG. This set of hearts is representative of two other experiments.

