Figure 4.
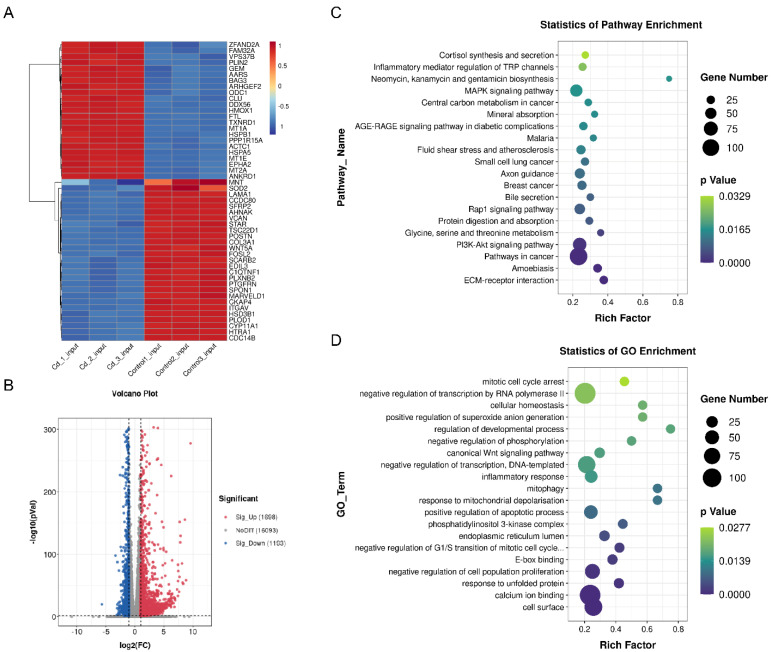
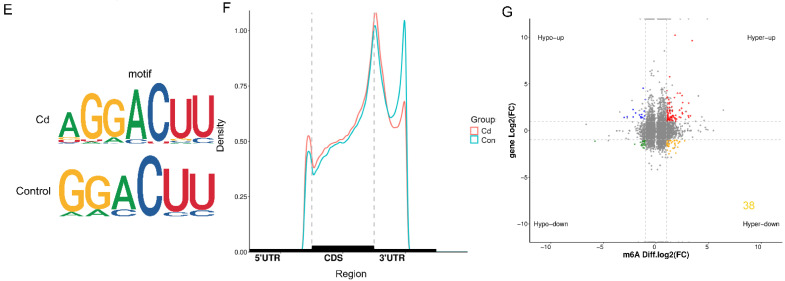
Transcriptome and MeRIP sequencing of the control and Cd groups. (A) Heat map results revealed differential transcript levels after Cd treatment. (B) Volcano map showed the differentially expressed mRNAs in the control and Cd groups. (C,D) GO and KEGG analyses results revealed the enrichment of differential genes in the control and Cd groups. (E) The HOMER motif analysis results revealed the m6A motif in granulosa cells. (F) Density distribution of m6A enrichment across mRNA transcriptome in granulosa cells. (G) Distribution of peaks with significant differences in the RNA expression and m6A modification level in the control and Cd groups.


