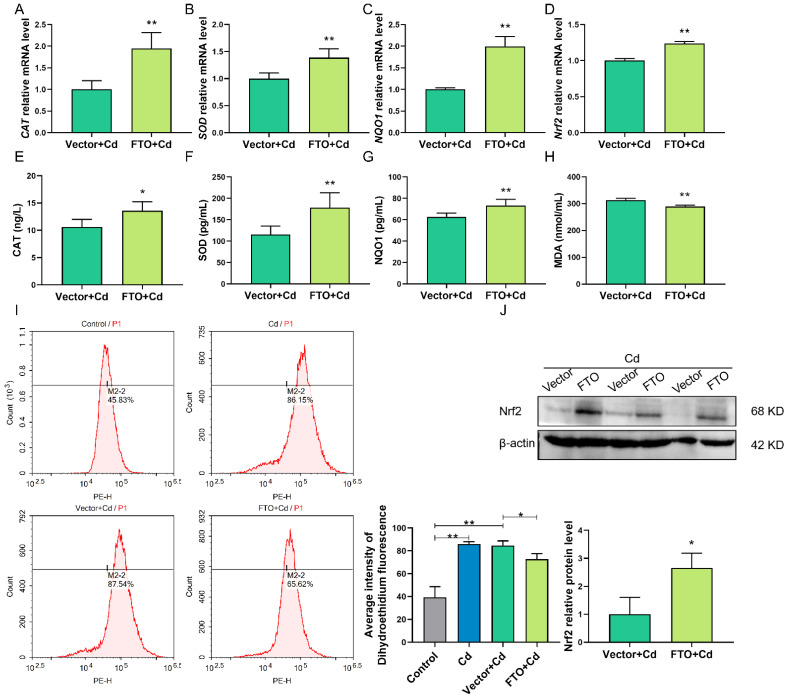
Figure 7.
FTO overexpression suppressed Cd-induced oxidative stress. (A–D) RT-qPCR revealed the mRNA levels of CAT, SOD, NQO1, and Nrf2 after Cd and FTO treatments. (E–H) ELISA results showed the intracellular levels of CAT, SOD, NQO1, and MDA after Cd and FTO treatments. (I) Intracellular ROS level was measured using flow cytometry analysis (DHE) in the control, Cd, Vector + Cd, and FTO + Cd groups. (J) Nrf2 protein levels were analyzed by Western blotting after Cd and FTO treatments. * p < 0.05; ** p < 0.01.

