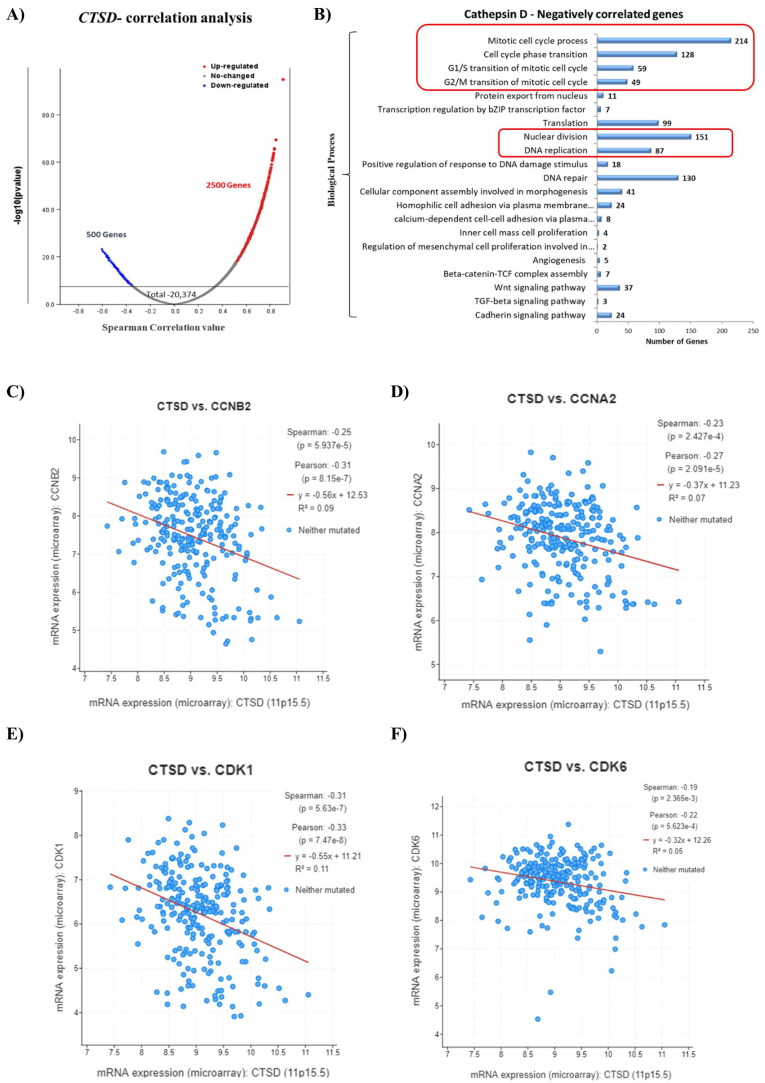
Figure 3.
High CTSD expression inversely correlates with genes involved in cell cycle progression. (A) Volcano plot displaying the differential expressed genes (DEGs). Red dots represent CTSD-positively correlated genes, while blue dots represent CTSD-negatively correlated genes. (B) Graph reporting the negatively correlated biological processes with CTSD. (C–F) Scatter plots showing the negative correlation between CTSD and CCNB2, CCNA2, CDK1, CDK6, respectively.

