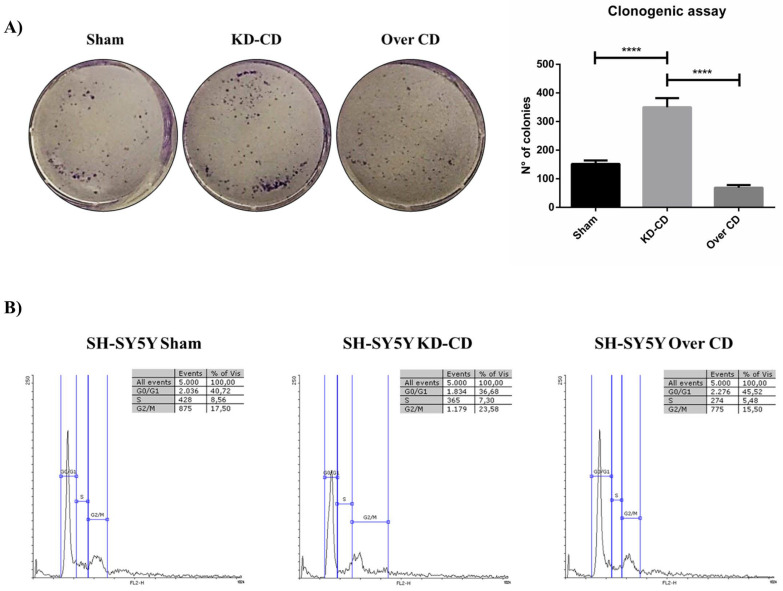
Figure 5.
SH-SY5Y Sham, KD-CD and Over CD clones show different growth rates depending on CD expression levels. (A) Clonogenic assay and representative graph of the new colonies formed during 10 days of culture. Cells were seeded in 6-well plates and stained with 0.5% crystal violet solution. Images were acquired and colony counting was performed using CellCounter software. Cell growth and number of colonies were estimated through photometric measurements using CellCounter software and are shown in the graph. Data ± S.D. are representative of three independent replicates. Significance was considered as follows: **** p < 0.0001. (B) Cell cycle analysis performed at 72 h. The percentage of cell populations in different cell cycle phases is reported. Quantification was performed using Flowing software 2.0.

