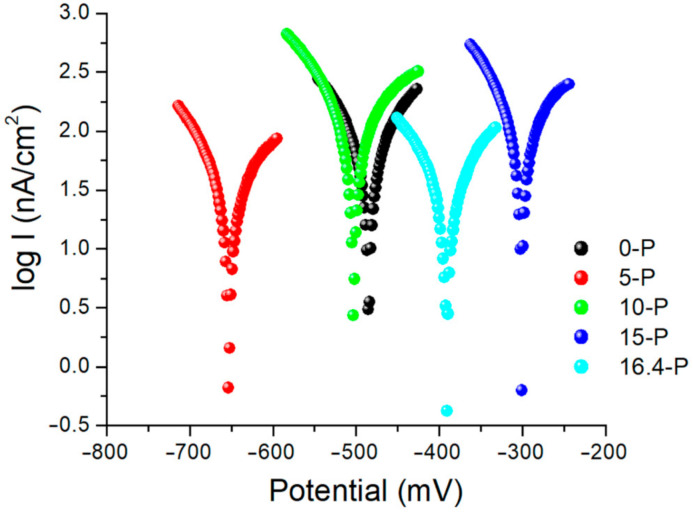
Figure 5.
Comparative representation of the potential dynamics curves for the samples 0-P (black); 5-P (red); 10-P (green); 15-P (blue) and 16.4-P (light blue) analyzed after casting. The tests were performed in the presence of Ringer’s solution. The estimation of linear polarization at corrosion can be conducted by the interpretation of Tafel diagrams. Corrosion current density, which is expressed related to the loss in thickness of the material from the surface for one year, was determined from Tafel’s equation graphically represented by Tafel diagrams of linear polarization (data not presented) and with logarithmic values of corrosion current density.

