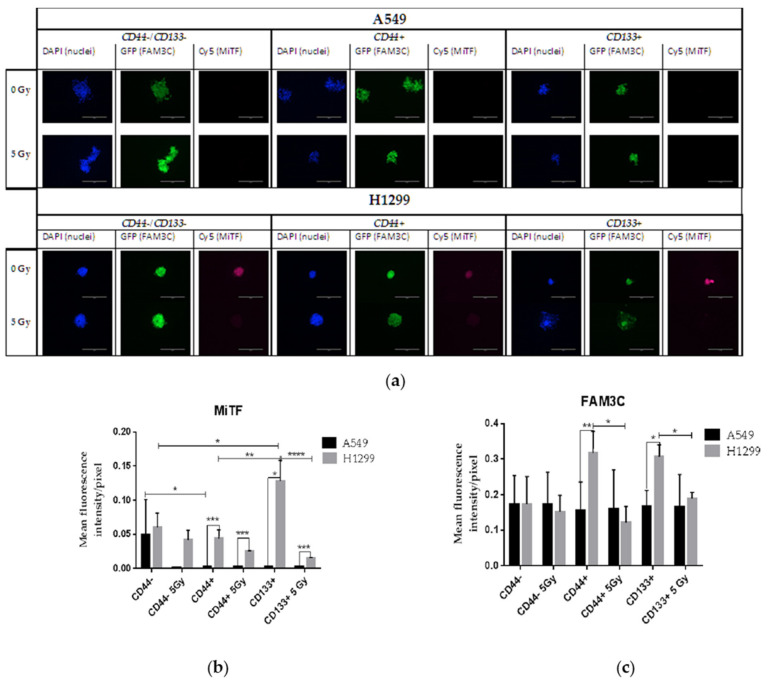
Figure 10.
Representative microphotographs of immunofluorescently stained spheroids showing DAPI (blue), FAM3C (GFP, green) and MiTF (Cy5, pink) (a). The expression of MITF (b) and FAM3C (c) in spheroid cultures derived from CD-sorted populations of A549 and H1299 cell lines four days after 5 Gy irradiation. Data are means ± SEM of more than three independent experiments. Where: * p < 0.05, ** p < 0.01, *** p < 0.001, **** p < 0.0001.

