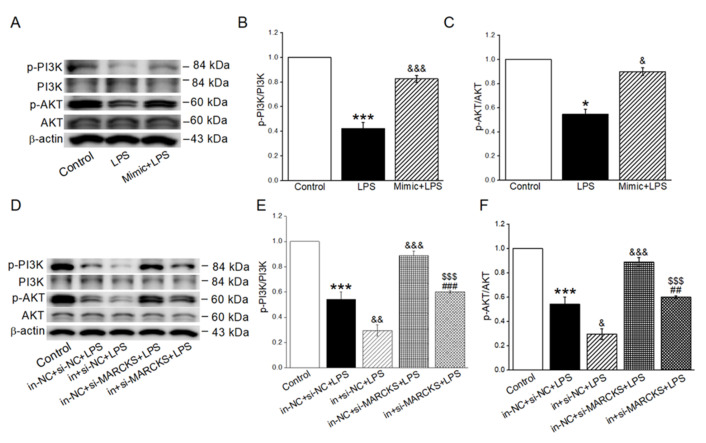
Figure 7.
MiR-34c activated the inhibition of PI3K/AKT signaling pathway in LPS-treated cells. (A) Representative Western blot bands of p-PI3K/PI3K and p-AKT/AKT in LPS-treated H441 cells transfected with miR-34c mimic. (B,C) Graphical representation of data obtained from Western blot assays for p-PI3K/PI3K and p-AKT/AKT. Bands were quantified by using gray analysis (p-PI3K/PI3K and p-AKT/AKT) (n = 4). (D) Representative Western blot bands of p-PI3K/PI3K and p-AKT/AKT in LPS-treated H441 cells transfected with miR-34c inhibitor and si-MARCKS. (E,F) Graphical representation of data obtained from Western blot assays for p-PI3K/PI3K and p-AKT/AKT. Bands were quantified by using gray analysis (p-PI3K/PI3K and p-AKT/AKT) (n = 4). Note: * p < 0.05, *** p < 0.001, compared with Control; & p < 0.05, && p < 0.01, &&& p < 0.001, compared with LPS and in-NC + si-NC + LPS; ## p < 0.01, ### p < 0.001, compared with in + si-NC + LPS; $$$ p < 0.001, compared with in-NC + si-MARCKS + LPS.

